Chapter 3.2 Variance and Standard Deviation
advertisement

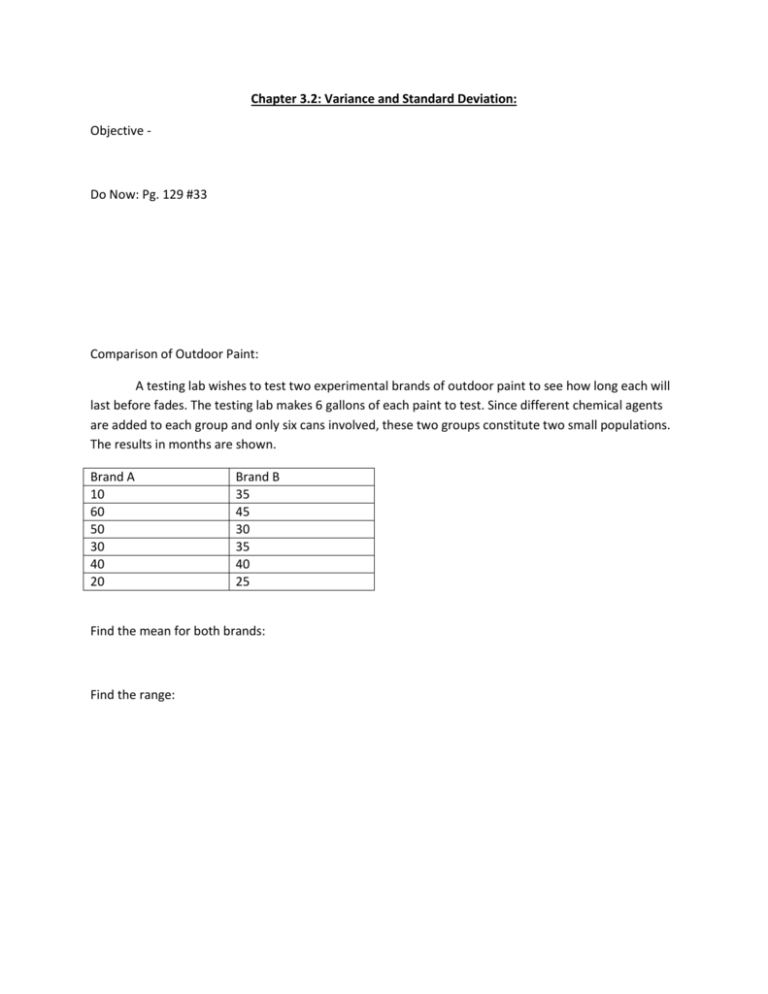
Chapter 3.2: Variance and Standard Deviation: Objective - Do Now: Pg. 129 #33 Comparison of Outdoor Paint: A testing lab wishes to test two experimental brands of outdoor paint to see how long each will last before fades. The testing lab makes 6 gallons of each paint to test. Since different chemical agents are added to each group and only six cans involved, these two groups constitute two small populations. The results in months are shown. Brand A 10 60 50 30 40 20 Brand B 35 45 30 35 40 25 Find the mean for both brands: Find the range: Definitions and formulas for variability of a data set: Variance – Standard Deviation – Steps for finding variance and standard deviation: 1. 2. 3. 4. 5. 6. Find the Variance and standard deviation of the two brands of paint: Values, X 10 60 50 30 40 20 Brand A X-µ (X - µ)2 Values, X 35 45 30 35 40 25 Formulas for Sample Variance and Standard Deviation: Steps for finding sample variance and standard deviation: 1. 2. 3. Brand B X-µ (X - µ)2 Example: Find the sample variance and standard deviation for the amount of European auto sales for a sample of 6 years shown. The data are in millions of dollars. 11.2, 11.9, 12.0, 12.8, 13.4, 14.3 Precipitation and High Temperatures: The normal daily high temperatures (in degrees Fahrenheit) in January for 10 selected cities are as follows: 50, 37, 29, 54, 30, 61, 47, 38, 34, 61 The normal monthly precipitation (in inches) for these same 10 cities is listed here: 4.8, 2.6, 1.5, 1.8, 1.8, 3.3, 5.1, 1.1, 1.8, 2.5 Which set is more variable?


