TEP
1.3.05
-05
Laws of Collision /
demonstration track
Related topics
Conservation of momentum, conservation of energy, linear motion, velocity, elastic loss, elastic collision,
inelastic collision.
Principle
The velocities of two carts, moving on a demonstration track, are measured before and after collision, for
both elastic and inelastic collision.
Equipment
2 Tube with plug
11202-05
2 Needle with plug
11202-06
1 Fork with plug
11202-08
1 Rubber bands f.fork w/plug,10 pcs
11202-09
1 Plate with plug
11202-10
1 Magnet w.plug f.starter system
11202-14
10 Slotted weight, 10 g, black
02205-01
6 Slotted weight, 50 g, black
02206-01
2 Light barrier, compact
11207-20
1 Timer 4-4
Portable Balance, OHAUS CS2000 1 AC adapter included
13604-99
48917-93
Demonstration Track, Aluminium,
1 Length: 1.5 m
11305-00
2 Cart, low friction sapphire bearings
11306-00
1 Starter system for demonstration track
11309-00
2 Weight for low friction cart, 400 g
11306-10
2 Shutter plate for low friction cart,
11308-00
2 Holder for light barrier
11307-00
1 End holder for demonstration track
11305-12
2 Connecting cord, 32 A, 1000 mm, red
Connecting cord, 32 A, 1000 mm, yel2 low
07363-01
2 Connecting cord, 32 A, 1000 mm, blue
07363-04
07363-02
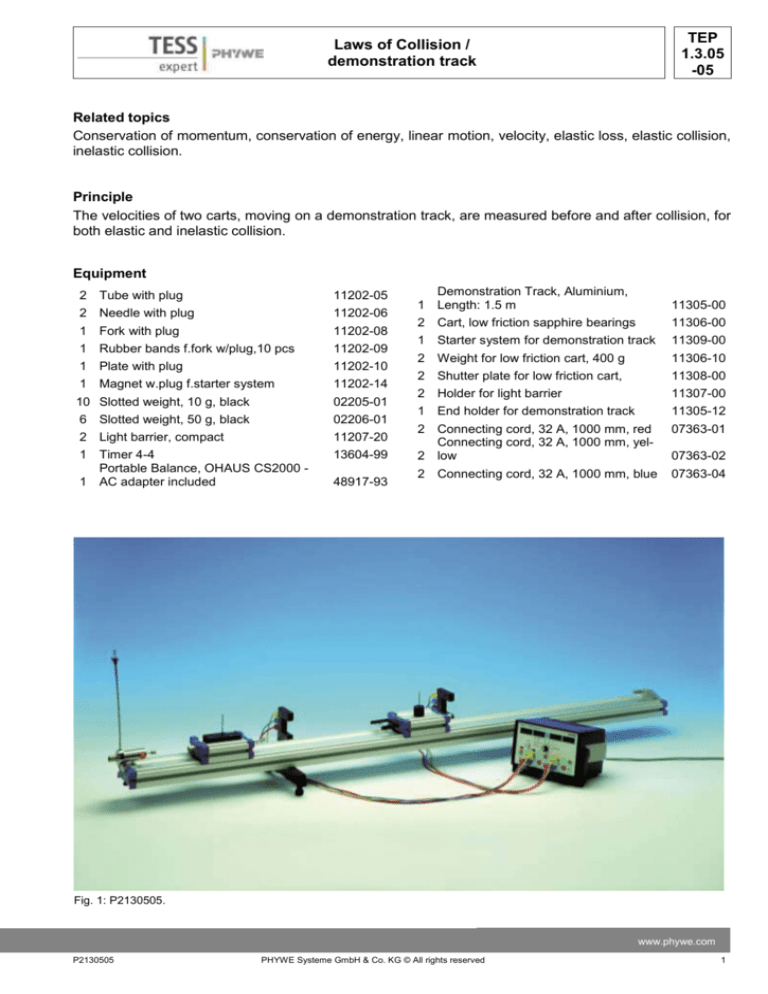
Fig. 1: P2130505.
www.phywe.com
P2130505
PHYWE Systeme GmbH & Co. KG © All rights reserved
1
TEP
1.3.05
-05
Laws of Collision /
demonstration track
Tasks
1. Elastic collision
A cart collides with a second resting cart at a constant velocity. A measurement series is conducted by
varying the mass of the resting cart: The corresponding velocities of the first cart before the collision and
the velocities of both carts after it are to be measured. Plot the following parameters as functions of the
mass ratio of the carts:
1.1 The impulses of the two carts as well as their sum after the collision. For comparison the mean
value of the impulses of the first cart is entered as a horizontal line in the graph.
1.2 Their energies, in a manner analogous to Task 1.1
1.3 In accordance with the mean value of the measured impulse of the first cart before the collision,
the theoretical values of the impulses for the two carts are entered for a range of mass ratios from 0
to 3. For purposes of comparison the measuring points (see 1.1) are plotted in the graph.
1.4 In accordance with the mean value of the measured energy of the first cart before the collision,
the theoretical values of the energy after the collision are plotted analogously to Task 1.3. In the
process, the measured values are compared with the theoretical curves.
2. Inelastic collision
A cart collides with a constant velocity with a second resting cart. A measurement series with different
masses of the resting cart is performed: the velocities of the first cart before the collision and those of
both carts, which have equal velocities, after it are to be measured.
2.1 The impulse values are plotted as in Task 1.1.
2.2 The energy values are plotted as in Task 1.2.
The theoretical and measured impulse values are compared as in Task 1.3.
As in Task 1.4, the theoretical an measured energy values are compared. In order to clearly illustrate the energy loss and its dependence on the mass ratios, the theoretical functions of the total
energy of both carts and the energy loss after the collision are plotted.
Set up and procedure
The experimental set-up is performed as shown in Fig. 1. The starting device serves to start the cart;
three defined and reproducible initial energies can be selected with the various latch positions. It is recommended that the second position is used for all measurements.
Connect the light barriers with input jacks 1 and 3 on the timer [connect jacks having the same colours
(red and yellow) and the two earth (ground) jacks to each other]. Select the “Collision experiments” operating mode (2 double arrows printed on the front panel). In this mode, up to two shading periods are
measured and displayed for each light barrier. When varying the mass ratios, ensure that the additional
masses are added symmetrically in each case. Before initiating the measurements, check the track’s adjustment.
The momentum is determined by measuring the velocity of the cart. For this purpose, the time during
which the screen fitted on the cart impinges on the light barrier is used, in accordance with:
2
PHYWE Systeme GmbH & Co. KG © All rights reserved
P2130505
TEP
1.3.05
-05
Laws of Collision /
demonstration track
Theory and evaluation
In the elastic collision of two bodies having masses m1 and m2, kinetic energy and momentum are conserved:
Due to the unidimensional sequence of movement, we will dispense with the vectorial notation. For a
central elastic with p2 = 0:
From the contribution of the impulse p, the energies E can be calculated according to E = p2/2m:
Fig. 2: Elastic collision: moment after the collision as functions
of the mass ratio of the carts.
Fig. 3: Elastic collision: energy after the collision as functions
of the mass ratio of the carts.
www.phywe.com
P2130505
PHYWE Systeme GmbH & Co. KG © All rights reserved
3
TEP
1.3.05
-05
Laws of Collision /
demonstration track
Fig. 2 and Fig. 3 show the results for a sample measurement. In particular, one can see that the total impulse and the total energy before and after the collision, except for a slight loss, are equal. The comparison of the measured values with the theoretical values according to the formulas given above can be
seen in Fig. 4 and Fig. 5.
Fig. 4: Elastic collision: calculated momenta after the collision
as functions of the mass ratio of the carts.
Fig. 5: Elastic collision: calculated energies after the collision
as functions of the mass ratio of the carts.
In an inelastic collision, only the momentum is conserved. In addition, the velocities after the collision are
equal:
Therefore,
The following is obtained for the energies of the two carts after the collision:
4
PHYWE Systeme GmbH & Co. KG © All rights reserved
P2130505
Laws of Collision /
demonstration track
TEP
1.3.05
-05
The evaluation of a sample measurement (Fig. 6 and Fig. 7) shows that also for an inelastic collision, the
total impulse is conserved; whereas, depending on m1/m2, a substantial energy loss occurs.
The theoretical curves are compared with the measured values in Fig. 8 and Fig. 9. In Fig. 9, the energy
loss is additionally plotted [energy loss = E1 – (E1 ' + E2 ' )] . One sees that for a mass ratio of 1, the
kinetic energy is reduced by exactly 50%.
Fig. 6: Inelastic collision: momenta after the collision as functions of the mass ratio of the carts.
Fig. 8: Inelastic collision: calculated moment after the collision
as functions of the mass ratio of the carts.
Fig. 7: Inelastic collision: energy after the collision as functions
of the mass ratio of the carts.
Fig. 9: Inelastic collision: calculated energies after the collision
and energy loss as functions of the mass ratio of the carts.
www.phywe.com
P2130505
PHYWE Systeme GmbH & Co. KG © All rights reserved
5

