ONLINE SUPPLEMENTARY MATERIAL Table S1: Summary of
advertisement
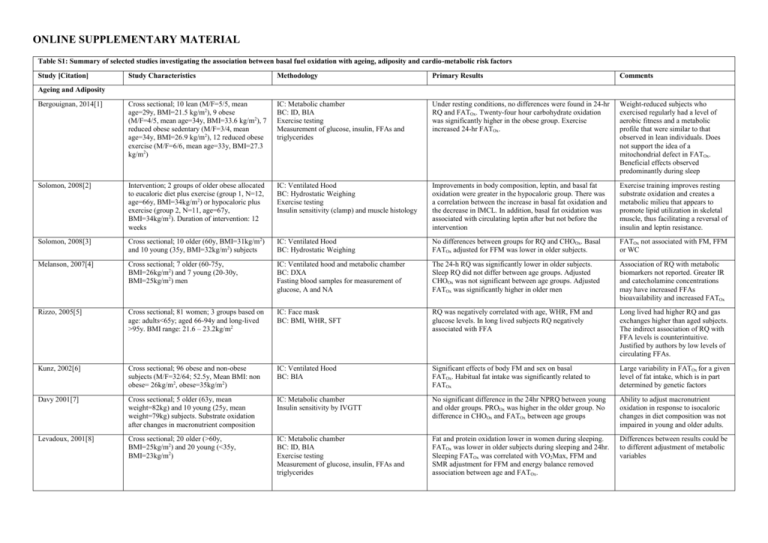
ONLINE SUPPLEMENTARY MATERIAL Table S1: Summary of selected studies investigating the association between basal fuel oxidation with ageing, adiposity and cardio-metabolic risk factors Study [Citation] Study Characteristics Methodology Primary Results Comments Bergouignan, 2014[1] Cross sectional; 10 lean (M/F=5/5, mean age=29y, BMI=21.5 kg/m2), 9 obese (M/F=4/5, mean age=34y, BMI=33.6 kg/m2), 7 reduced obese sedentary (M/F=3/4, mean age=34y, BMI=26.9 kg/m2), 12 reduced obese exercise (M/F=6/6, mean age=33y, BMI=27.3 kg/m2) IC: Metabolic chamber BC: ID, BIA Exercise testing Measurement of glucose, insulin, FFAs and triglycerides Under resting conditions, no differences were found in 24-hr RQ and FATOx. Twenty-four hour carbohydrate oxidation was significantly higher in the obese group. Exercise increased 24-hr FATOx. Weight-reduced subjects who exercised regularly had a level of aerobic fitness and a metabolic profile that were similar to that observed in lean individuals. Does not support the idea of a mitochondrial defect in FATOx. Beneficial effects observed predominantly during sleep Solomon, 2008[2] Intervention; 2 groups of older obese allocated to eucaloric diet plus exercise (group 1, N=12, age=66y, BMI=34kg/m2) or hypocaloric plus exercise (group 2, N=11, age=67y, BMI=34kg/m2). Duration of intervention: 12 weeks IC: Ventilated Hood BC: Hydrostatic Weighing Exercise testing Insulin sensitivity (clamp) and muscle histology Improvements in body composition, leptin, and basal fat oxidation were greater in the hypocaloric group. There was a correlation between the increase in basal fat oxidation and the decrease in IMCL. In addition, basal fat oxidation was associated with circulating leptin after but not before the intervention Exercise training improves resting substrate oxidation and creates a metabolic milieu that appears to promote lipid utilization in skeletal muscle, thus facilitating a reversal of insulin and leptin resistance. Solomon, 2008[3] Cross sectional; 10 older (60y, BMI=31kg/m2) and 10 young (35y, BMI=32kg/m2) subjects IC: Ventilated Hood BC: Hydrostatic Weighing No differences between groups for RQ and CHOOx. Basal FATOx adjusted for FFM was lower in older subjects. FATOx not associated with FM, FFM or WC Melanson, 2007[4] Cross sectional; 7 older (60-75y, BMI=26kg/m2) and 7 young (20-30y, BMI=25kg/m2) men IC: Ventilated hood and metabolic chamber BC: DXA Fasting blood samples for measurement of glucose, A and NA The 24-h RQ was significantly lower in older subjects. Sleep RQ did not differ between age groups. Adjusted CHOOx was not significant between age groups. Adjusted FATOx was significantly higher in older men Association of RQ with metabolic biomarkers not reported. Greater IR and catecholamine concentrations may have increased FFAs bioavailability and increased FATOx Rizzo, 2005[5] Cross sectional; 81 women; 3 groups based on age: adults<65y; aged 66-94y and long-lived >95y. BMI range: 21.6 – 23.2kg/m2 IC: Face mask BC: BMI, WHR, SFT RQ was negatively correlated with age, WHR, FM and glucose levels. In long lived subjects RQ negatively associated with FFA Long lived had higher RQ and gas exchanges higher than aged subjects. The indirect association of RQ with FFA levels is counterintuitive. Justified by authors by low levels of circulating FFAs. Kunz, 2002[6] Cross sectional; 96 obese and non-obese subjects (M/F=32/64; 52.5y, Mean BMI: non obese= 26kg/m2, obese=35kg/m2) IC: Ventilated Hood BC: BIA Significant effects of body FM and sex on basal FATOx. Habitual fat intake was significantly related to FATOx Large variability in FATOx for a given level of fat intake, which is in part determined by genetic factors Davy 2001[7] Cross sectional; 5 older (63y, mean weight=82kg) and 10 young (25y, mean weight=79kg) subjects. Substrate oxidation after changes in macronutrient composition IC: Metabolic chamber Insulin sensitivity by IVGTT No significant difference in the 24hr NPRQ between young and older groups. PROOx was higher in the older group. No difference in CHOOx and FATOx between age groups Ability to adjust macronutrient oxidation in response to isocaloric changes in diet composition was not impaired in young and older adults. Levadoux, 2001[8] Cross sectional; 20 older (>60y, BMI=25kg/m2) and 20 young (<35y, BMI=23kg/m2) IC: Metabolic chamber BC: ID, BIA Exercise testing Measurement of glucose, insulin, FFAs and triglycerides Fat and protein oxidation lower in women during sleeping. FATOx was lower in older subjects during sleeping and 24hr. Sleeping FATOx was correlated with VO2Max, FFM and SMR adjustment for FFM and energy balance removed association between age and FATOx. Differences between results could be to different adjustment of metabolic variables Ageing and Adiposity Soares, 2000[9] Cross sectional; 76 subjects, M/F=42/34; 28 older (>50y, BMI=26kg/m2) and 48 young (1835y, BMI=23kg/m2) men IC: Ventilated Hood BC: ID, DXA Plasma leptin There were no differences in RQ between gender and age groups. No association between RQ and leptin in the whole sample whereas a significant indirect association was found in older men Leptin may be involved in lipid partitioning in older subjects Weyer, 1999[10] Cross sectional; 916 non-diabetic subjects (M/F=561/355; 31.5y, weight range= 42.2215.2) IC: Metabolic chamber BC: Hydrostatic Weighing, DXA 24-hr RQ did not differ between males and females. WC and percent body fat significant determinants of 24-hr RQ. Basal substrate oxidation was not reported Toth, 1999[11] Cross sectional; 59 middle aged premenopausal women (age range: 47y, weight range=47-104kg) IC: Ventilated Hood BC: DXA, BIA Exercise Testing Measurement of glucose, insulin, FFAs and triglycerides, leptin Significant correlations of REE and substrate oxidation to fat-free mass, appendicular skeletal muscle mass, and leptin. Leptin a predictor of CHOOx. Positive association of FATOx with REE FATOx may be determined by the basal energy needs of the metabolically active tissue. Leptin may regulate CHOOx by affecting hepatic glycogenolysis, peripheral glucose utilization, or both. Marra, 1998[12] Longitudinal; 58 women (age range: 40y, mean BMI=24.7kg/m2). IC: Ventilated Hood Changes in body weight after 3 years Baseline RQ was not related to age, weight or BMI. Age and RQ at baseline significantly predicted changes in either weight or BMI. Energy balance and diet composition prior to RQ measurement not controlled; hypothesis of defective fat oxidation. Toth, 1998[13] Cross sectional; 12 older men (70y, weight=73kg) and 12 older women (66y, weight=65kg) IC: Ventilated Hood Measurement of FFAs availability and noradrenaline appearance rate FATOx was higher in men at rest compared with women and remained higher after statistical control for resting oxygen consumption. No gender differences in RQ were found during exercise. These differences were independent of noradrenaline appearance rate, FFAs availability The role of gender as a modifier of substrate oxidation and interaction with ageing is still an open question for metabolic research Valtuena, 1997[14] Longitudinal; 36 obese subjects (M/F=1/35; 37.2y, mean BMI=44.0kg/m2). Follow-up of 3, 6 and 12 months IC: Ventilated Hood BC: Hydrostatic Weighing RQ was negatively associated with BMI and maximal lifetime weight. High RQ was a significant predictor of weight regain at 12 months. Basal RQ was lower in men compared to women. Hypotheses: patients with higher lipolytic activity could be better able to increase FATOx; an increased rate of CHOOx/ FATOx may decrease glycogen stores resulting in increased appetite; a higher RQ could reflect a deviation from the steady-state Horber, 1996[15] Cross sectional; 119 subjects (M/F=60/59, age range: 20-81y, mean BMI=23.5kg/m2). IC: Ventilated Hood (urine collection for measurement of N excretion) BC: DXA Analyses stratified by age groups (young vs older) No differences between groups for RQ, PROOx and CHOOx. FATOx adjusted for FFM was lower in older males. FATOx adjusted for FFM decreased with increasing age in males but not females. FATOx adjusted for FFM increased with FM in females but not in males. Dimorphism in adaptation of FATOx with FM proposed as a mechanism for greater propensity of males to gain weight. Nagy, 1996[16] Cross sectional; 720 subjects (M/F=427/293, age range: 17-90y, weight range=38.4 – 132.2kg) IC: Ventilated Hood BC: Hydrostatic Weighing Measurement of glucose, insulin and triglycerides FATOx was negatively associated with age in both males and females. It was also negatively correlated with FM, fasting insulin and triglycerides and positively with FFM. In multiple regression model, FATOx was predicted by Peak VO2, FFM, thyroxin, and fasting insulin RQ not reported. Fat oxidation not greater in obese subjects. One of the few studies to report a significant role of FFM. Rising, 1996[17] Longitudinal; 7 non-diabetic Pima Indian men (mean age=31y, mean weight= 111kg) IC: Metabolic chamber Over a 7-year period, mean unadjusted and adjusted 24-hour RQ increased Reduced fat utilization and decreased BMR with age may both contribute to increasing obesity in older individuals Roberts, 1996[18] Overfeeding study; 9 older men (70y, weight=73kg) and 7 older women (24y, weight=76kg). Primary outcome: difference in TEF; fasting and post-prandial RQ reported IC: Face mask BC: ID There was no significant difference between age groups in the change in TEF. There was a significant effect of agegroup on the fasting RQ (values for young men were lower), and the increase in RQ following consumption of the test meals was significantly lower in the older group. Differences driven potentially by lower activation of sympathetic tone. Older individuals experience a decreased ability to dissipate excess energy intake during overeating Calles Escandon, 1995[19] Cross sectional; 32 women, age range: 18-73y, weight range=44 – 103kg) IC: Ventilated Hood BC: Hydrostatic Weighing Measurement of glucose, FFAs and insulin FATOx was negatively associated with age but positively associated with FFM and aerobic fitness. No relationship was found with FM and metabolic biomarkers. Residual approach to test whether FFM was main driver of FATOx. This approach removed the association of age and fitness with FATOx, which is therefore explained by age related decline in FFM Astrup, 1994[20] Cross sectional; 38 obese women (mean age=34y; mean weight=93kg) and 35 lean women (mean age=33y; mean weight=60kg) IC: Metabolic chamber BC: BIA Obese women exhibited lower 24hr RQ. Positive association between EE, FM and FATOx. Association between FM and FATOx remained significant after adjustment for dietary fat, age and EB. Basal RQ was again higher in obese women and basal FATOx was positively correlated to FM. For each 10-kg increase in FM there is an expected increase in FATOx that averages 11 g/d. Seidell, 1992[21] Longitudinal (BLSA); 775 men (age 18-98). Follow up: 10 years IC: Ventilated Hood BC: weight change RQ, but not REE, was positively related to weight change. Major weight gain (from at least 5 kg to at least 15 kg) was related to initial RQ in non-obese men. Relatively high fasting RQ was a weak but significant predictor of substantial weight gain in non-obese white men Schutz, 1992[22] Study 1 (cross sectional): 106 women divided by FM (low FM: weight=71kg, FM=25kg; high FM: weight=91kg, FM=38kg). Study 2 (WL study): 24 obese, age=59y, preweight=74kg, post-weight=61kg. IC: Ventilated Hood BC: BIA Study 1: FM was significantly associated with RQ (inverse) and FATOx (direct) Study 2: Fat oxidation fell an average of 42% FATOx increases with changes in body fat (gain, loss). For each 10-kg increase in FM there is an expected increase in FATOx that averages 20 g/d. Zurlo, 1990[23] Longitudinal; 152 Pima Indians (M/F=87/65, age: 27y, mean weight=93.9kg). Mean follow up: 25 months IC: Metabolic chamber BC: Hydrostatic Weighing High 24-h RQ was significantly correlated with subsequent increase in body weight and FM. Effect was independent of energy expenditure Family membership was the principal determinant of the ratio of fat to carbohydrate oxidation. Cardio-Metabolic Risk Factors Montalcini, 2014[24] Cross sectional; 40 unrelated obese subjects; 20 affected by hypertriglyceridemia (mean age=49y, mean BMI=35.7kg/m2) and 20 unaffected (mean age=49y, mean BMI=36.3kg/m2) IC: Ventilated Hood Measurement of glucose, lipids, insulin High TG levels are associated with greater RQ Suggested role of insulin in suppressing lipid oxidation Montalcini, 2014[25] Cross sectional; 35 overweight/obese subjects (M/F=8/27, mean BMI=32kg/m2, mean age=52y) IC: Ventilated Hood Ultrasound for assessment of LVCR and CIMT RQ was higher in subjects with LVCR and high CIMT The area under the receiver operating characteristic (ROC) curve for RQ to predict LVCR was 0.72 Galgani, 2014[26] Cross sectional; 30 subjects (M/F=15/15, mean age=35y, mean BMI=27kg/m2) IC: Ventilated hood and metabolic chamber BC: DXA OGTT and euglycemic–hyperinsulinemic clamp: Si and Beta Cell Function Fasting non-protein RQs did not correlate with insulin sensitivity but correlated with insulin rate sensitivity and insulin secretion rate (i.e., 24-hr urinary C peptide excretion) Insulin secretion rate estimated from urinary C-peptide was related to carbohydrate balance and oxidation Croci, 2013[27] Cross sectional; 20 overweight with NAFLD (M/F=12/8, age=48, BMI=34kg/m2) and 15 lean healthy controls (M/F=10/5, age=41, BMI=23kg/m2) IC: Ventilated Hood BC: DXA, CT scan Insulin Sensitivity (Clamp) Graded exercise test Ketone bodies, TG NAFLD patients oxidised less fat compared to controls and confirmed by a greater basal RQ in the NAFLD group. Basal RQ directly correlated with liver steatosis but not with visceral fat, FM or BMI of ketone bodies. Reduced basal hepatic FATOx in NAFLD was associated with increased fasting circulating TG. NAFLD patients demonstrated metabolic inflexibility, which was defined as an impaired capacity to adapt fuel oxidation to fuel availability. Also a reduced ability to increase fat oxidation during an acute exercise session Montalcini, 2013[28] Cross sectional; 132 subjects (M/F=52/70, mean age=48y, mean BMI=33.6kg/m2) IC: Ventilated Hood Ultrasound for assessment CIMT RQ was significantly associated with CIMT. RQ was not associated with age, WC and systolic BP Role of insulin as a modulator of the effects on intermediate metabolism and connection with atherosclerosis pathogenesis Korenaga, K[29] Cross sectional; 32 patients with NAFLD (M/F=24/8; age=45y, BMI=27kg/m2) IC: Ventilated Hood Fibrosis associated with a decrease in basal RQ; RQ Suggestion of use of RQ as marker of OGTT negatively associated with glucose AUC disease severity Liver biopsy Ferro, 2013[30] Cross sectional; 223 subjects (M/F=90/133, IC: Ventilated Hood In multivariate model, RQ only correlated with Systolic BP. RQ not associated with indexes of mean age=53y, mean BMI=31.5kg/m2) Assessment of MetSyn and individual RQ>0.90 greater prevalence of hypertension adiposity and age. biomarkers (WC, GLU, HDL, TG, Systolic BP, Diastolic BP) M= male; F= female; BMI= body mass index; IC= indirect calorimetry; BC= body composition; ID= isotope dilution; BIA= bioelectrical impedance; FFA= free fatty acids; RQ= respiratory quotient; FATOx= fat oxidation; CHOOx = carbohydrate oxidation; FM= fat mass; FFM= fat free mass; WC= waist circumference; DXA= dual x ray absorptiometry; A= adrenaline; NA= nor-adrenaline; IR= insulin resistance; WHR= wait hip ratio; SFT= skinfold thickness; IVGTT= intra venous glucose tolerance test; PROOx = protein oxidation; SMR = sleeping metabolic rate; REE = resting energy expenditure; TEF = thermic effect of food; EE = energy expenditure; EB= energy balance; TG = triglycerides; CIMT= carotid intima media thickness; LVCR= Left ventricular concentric remodelling; OGTT= oral glucose tolerance test; NAFLD = non-alcoholic fatty liver disease; BP = blood pressure; GLU = glucose; HDL = high density lipoproteins; IMCL= intra myocellular lipids; OGTT = oral glucose tolerance test. Table S2: Description of the main characteristics of the study population stratified by sex (male, female) and age (18-39y, 40-59y and ≥60y) All Female 18-39y 40-59y ≥60y 18-39y 40-59y ≥60y 992 1463 364 733 963 229 N Smoking Yes No Former BMI Category (N) Normal Weight Overweight Obese Male 18-39y 259 40-59y 500 ≥60y 135 P Value p<0.001 292 551 149 241 834 388 54 179 131 207 420 106 152 589 222 35 137 57 85 131 43 89 245 166 19 61 135 304 375 313 304 589 570 42 119 203 273 256 204 268 395 300 36 81 112 31 119 109 36 194 270 6 38 91 Disease Count (N) 1.5 (1.4) 2.3 (1.8) 3.7 (2.2) 1.4 (1.3) 2.3 (1.8) 3.7 (2.2) 1.6 (1.4) 2.5 (1.7) 3.7 (2.0) PAL (METs/week)* 1062 (297, 2491) 876 (198, 1986) 1074 (297, 2612) 990 (279, 2346) 838 (198, 1980) 1032 (297, 2520) 1356 (396, 3012) 918 (199, 2023) 1158 (297, 2655) FM (kg) 27.21 (11.87) 28.92 (11.42) 32.92 (11.23) 27.24 (11.61) 28.68 (11.10) 32.98 (11.20) 27.33 (12.49) 29.52 (12.07) 32.99 (11.45) FFM (kg) 51.64 (11.26) 52.82 (11.67) 50.44 (11.17) 46.18 (5.63) 45.91 (5.81) 43.30 (5.19) 66.97 (8.45) 66.14 (7.99) 62.48 (7.48) Height (cm) 166.4 (8.7) 166.3 (9.0) 163.5 (9.0) 162.8 (6.0) 161.6 (6.3) 158.2 (5.7) 176.6 (6.6) 175.3 (6.2) 172.6 (6.0) Mediterranean Diet ScoreA 6.1 (1.63) N=826 6.6 (1.65) N=1208 7.6 (1.61) N=259 6.1 (1.6) N=609 6.6 (1.6) N=789 7.6 (1.6) N=149 6.1 (1.6) N=217 6.5 (1.7) N=419 7.5 (1.6) N=110 921 71 - 1385 78 338 26 - 683 50 - 919 44 208 21 - 238 21 - 466 34 - 130 5 - Dieting No Yes Menopause No Yes - 0.003 A: p<0.001 S: p<0.001 A*S: 0.80 A: p<0.001 S: 0.04 A*S: 0.01 A: p<0.001 S: 0.56 A*S: 0.71 A: p<0.001 S: p<0.001 A*S: 0.16 A: p<0.001 S: p<0.001 A*S: 0.65 A: p<0.001 S: p=0.60 A*S: 0.85 Female: p=025 Male: p=016 - 624 338 Mean (SD) presented for normally distributed variables. Median (upper and lower quartiles) presented from not normally distributed variables. N= number of subjects; BMI= body mass index; PAL= physical activity level; MET= metabolic equivalent time. FM= fat mass; FFM= fat free mass; *log transformed before analyses. A= Age; S= Sex; A*S= Age*Sex Interaction term. A Sample size was different from main analyses due to missing data for this variable . Table S3: Multiple linear regression to identify predictors of total (fat mass index) and segmental adiposity (pre-peritoneal and abdominal visceral and sub-cutaneous fat) measured by bioelectrical impedance and ultrasonography, respectively. Fat Mass Index (kg/m2) VAT (cm)* SAT (cm)* b SE P b SE P b SE p-value 0.34 0.48 0.10 R² -13.089 1.199 -1.149 0.124 -0.509 0.152 Intercept <0.001 <0.001 <0.001 0.054 0.006 0.011 0.001 -0.003 0.001 Age (years) <0.001 <0.001 <0.001 -6.726 0.214 0.067 0.022 -0.362 0.027 Sex (Male, Female) <0.001 <0.001 <0.001 0.043 0.104 0.67 -0.004 0.011 0.67 -0.008 0.013 0.53 Smoking (yes, no) -1.803 1.203 0.13 0.088 0.124 0.47 0.163 0.153 0.28 RQ 0.302 0.040 0.030 0.004 0.015 0.005 Disease Count (n) <0.001 <0.001 <0.001 -0.016 0.003 -0.001 0.0003 -0.002 0.0004 PAL (METs/week)* <0.001 <0.001 <0.001 1.306 0.040 0.111 0.004 0.086 0.005 FFMI (kg/m2) <0.001 <0.001 <0.001 B= raw regression coefficient; SE= standard error; R 2= coefficient of determination; FMI= fat mass index; FFMI= fat free mass index; RQ= respiratory quotient; PAL= physical activity level; MET= metabolic equivalent time; SAT= sub cutaneous adipose tissue; VAT= visceral adipose tissue. Significant results are highlighted in bold. *log transformed before analyses. Figure S2: Probability of metabolic syndrome (MetSyn) with fat free mass index (FFMI). Logistic models were represented unadjusted (dotted line, ∙ ∙ ∙ ∙ ∙ ∙ ∙ ), partially adjusted for lifestyle factors and health status [age, smoking, disease count and physical activity (solid black like, ───)] and fully adjusted for lifestyle factors and health status and metabolic (RQ, REE) and body composition variables [fat free mass index (FFMI), FMI, visceral and subcutaneous adiposity (solid grey line, ───)]. Bubble plots were used to indicate the frequency of distribution of each independent variable in the two metabolic syndrome groups (0= no metabolic syndrome; 1= metabolic syndrome). Table S4: Multiple linear regression to identify lifestyle and body composition predictors of cardiovascular risk factors and cumulative metabolic risk (N=2293) Glucose Systolic BP Diastolic BP HDL Triglycerides (mg/dL)* (mmHg)* (mmHg)* (mg/dL)* (mg/dL)* b SE P b SE P SE P 0.33 b SE P 0.35 b Z Score SE P 0.24 b SE P R² 0.23 Intercept 4.20 0.04 <0.001 4.39 0.03 <0.001 3.93 0.04 <0.001 4.64 0.08 <0.001 3.17 0.17 <0.001 -13.62 0.90 <0.001 Age (years) 0.002 0.0002 <0.001 0.002 0.0002 <0.001 0.002 0.0002 <0.001 0.002 0.0004 <0.001 0.002 0.001 <0.001 0.05 0.005 <0.001 Sex (Male, Female) 0.009 0.01 0.35 0.02 0.007 0.004 0.04 0.009 <0.001 -0.15 0.01 <0.001 0.10 0.04 0.007 1.20 0.20 <0.001 Smoking (yes, no) 0.007 0.003 0.07 -0.005 0.002 0.08 -0.002 0.003 0.52 0.02 0.006 <0.001 -0.04 0.01 0.002 -0.20 0.07 <0.001 Mediterranean Diet Score 0.009 0.001 0.56 -0.0004 0.001 0.71 -0.001 0.001 0.14 -0.001 0.002 0.66 0.009 0.005 0.10 0.005 0.02 0.85 Dieting (yes, no) 0.002 0.001 0.84 0.006 0.007 0.44 -0.003 0.009 0.67 0.04 0.03 0.06 0.0001 0.03 0.99 -0.11 0.20 0.56 RQ -0.07 0.04 0.12 -0.007 0.03 0.81 0.01 0.03 0.68 -0.002 0.08 0.97 0.32 0.12 0.05 0.86 0.56 0.56 REE (kcal/day) 0.0005 0.00001 0.001 0.0001 0.00001 <0.001 0.00010 0.00001 <0.001 -0.000001 0.00003 0.63 0.0002 0.0007 0.003 0.003 0.0003 <0.001 Disease Count (n) 0.006 0.001 <0.001 0.003 0.001 <0.001 0.002 0.001 0.11 -0.007 0.002 0.01 0.03 0.005 <0.001 0.17 0.03 <0.001 PAL (METs/week)* -0.0002 0.00009 0.01 0.0001 0.00007 0.04 0.00001 0.00009 0.55 0.0002 0.0002 0.38 0.0002 0.0003 0.49 0.0003 0.0002 0.86 FFMI (kg/m2) 0.005 0.002 0.007 0.001 0.001 0.33 0.002 0.0001 0.14 -0.02 0.003 <0.001 -0.001 0.01 0.87 0.15 0.04 <0.001 FMI (kg/m2) 0.002 0.009 0.01 0.003 0.0007 <0.001 0.004 0.0007 <0.001 -0.002 0.003 0.10 -0.005 0.003 0.16 0.08 0.01 <0.001 VAT (cm) 0.03 0.008 <0.001 0.01 0.006 0.02 0.01 0.007 0.06 -0.08 0.01 <0.001 0.27 0.03 <0.001 1.19 0.15 <0.001 SAT (cm)* -0.01 0.006 0.04 0.009 0.004 0.07 0.02 0.005 <0.001 -0.003 0.02 0.66 0.05 0.02 0.03 0.10 0.12 0.41 * 0.38 b Metabolic Risk 0.53 B= raw regression coefficient; SE= standard error; R2= coefficient of determination; REE= resting energy expenditure; FMI= fat mass index; FFMI= fat free mass index; RQ= respiratory quotient; BP= blood pressure; PAL= physical activity level; MET= metabolic equivalent time; SAT= sub cutaneous adipose tissue; VAT= visceral adipose tissue. Significant results are highlighted in bold. *log transformed before analyses. Table S5: Logistic regression to evaluate the risk for Metabolic Syndrome (dependent variable, binary) associated with metabolic and body composition measurements (N=2293) β (SE) OR (95% CI) P value RQ 0.24 (0.99) 1.27 (0.18 – 8.98) 0.80 REE (kcal/day) 0.001 (0.004) 1.00 (1.00 – 1.01) 0.001 0.07 (0.02) 1.07 (1.03 – 1.12) <0.001 Model A 2 FMI (kg/m ) 0.10 (0.04) 1.11 (1.01 – 1.21) 0.02 * 1.39 (0.20) 4.05 (2.73 – 6.01) <0.001 * 0.18 (0.16) 1.20 (0.87 – 1.67) 0.72 2 FFMI (kg/m ) VAT (cm) SAT (cm) β= Regression Coefficient; SE= standard error; OR= odds ratio (95% Confidence Intervals); FMI= fat mass index; FFMI= fat free mass index; RQ= respiratory quotient; REE= resting energy expenditure; SAT= sub cutaneous adipose tissue; VAT= visceral adipose tissue. Significant results are highlighted in bold. *log transformed before analyses. AModel adjusted for age, sex, smoking, disease count, Mediterranean Diet Score, dieting and physical activity level. Table S6: Logistic regression to evaluate the risk for Metabolic Syndrome (dependent variable, binary) in middle aged women (N=962, 40-59y) associated with metabolic and body composition measurements β (SE) OR (95% CI) P value ModelA RQ REE (kcal/day) 2 FMI (kg/m ) 1.27 (0.18 – 8.98) 0.80 0.002 (0.0007) 1.00 (1.00 – 1.01) 0.002 0.03 (0.03) 1.03 (0.97 – 1.10) 0.26 0.02 (0.07) 1.02 (0.87 – 1.19) 0.76 * 2.01 (0.30) 7.46 (4.09– 13.60) <0.001 * 0.22 (0.28) 1.25 (0.72 – 2.17) 0.72 2 FFMI (kg/m ) VAT (cm) SAT (cm) 0.82 (0.99) β= Regression Coefficient; SE= standard error; OR= odds ratio (95% Confidence Intervals); FMI= fat mass index; FFMI= fat free mass index; RQ= respiratory quotient; REE= resting energy expenditure; SAT= sub cutaneous adipose tissue; VAT= visceral adipose tissue. Significant results are highlighted in bold. *log transformed before analyses. AModel adjusted for age, sex, smoking, disease count, Mediterranean Diet Score, dieting, menopausal status, and physical activity level. References 1 Bergouignan A, Kealey EH, Schmidt SL, Jackman MR, Bessesen DH. Twenty-four hour total and dietary fat oxidation in lean, obese and reduced-obese adults with and without a bout of exercise. PloS one 2014; 9: e94181. 2 Solomon TP, Sistrun SN, Krishnan RK, et al. Exercise and diet enhance fat oxidation and reduce insulin resistance in older obese adults. J Appl Physiol (1985) 2008; 104: 1313-9. 3 Solomon TP, Marchetti CM, Krishnan RK, Gonzalez F, Kirwan JP. Effects of aging on basal fat oxidation in obese humans. Metabolism: clinical and experimental 2008; 57: 1141-7. 4 Melanson EL, Donahoo WT, Grunwald GK, Schwartz R. Changes in 24-h substrate oxidation in older and younger men in response to exercise. J Appl Physiol (1985) 2007; 103: 1576-82. 5 Rizzo MR, Mari D, Barbieri M, et al. Resting metabolic rate and respiratory quotient in human longevity. The Journal of clinical endocrinology and metabolism 2005; 90: 409-13. 6 Kunz I, Schorr U, Rommling K, Klaus S, Sharma AM. Habitual fat intake and basal fat oxidation in obese and non-obese Caucasians. International journal of obesity and related metabolic disorders : journal of the International Association for the Study of Obesity 2002; 26: 150-6. 7 Davy KP, Horton T, Davy BM, Bessessen D, Hill JO. Regulation of macronutrient balance in healthy young and older men. International journal of obesity and related metabolic disorders : journal of the International Association for the Study of Obesity 2001; 25: 1497-502. 8 Levadoux E, Morio B, Montaurier C, et al. Reduced whole-body fat oxidation in women and in the elderly. International journal of obesity and related metabolic disorders : journal of the International Association for the Study of Obesity 2001; 25: 39-44. 9 Soares MJ, Piers LS, O'Dea K, Collier GR. Plasma leptin concentrations, basal metabolic rates and respiratory quotients in young and older adults. International journal of obesity and related metabolic disorders : journal of the International Association for the Study of Obesity 2000; 24: 1592-9. 10 Weyer C, Snitker S, Rising R, Bogardus C, Ravussin E. Determinants of energy expenditure and fuel utilization in man: effects of body composition, age, sex, ethnicity and glucose tolerance in 916 subjects. International journal of obesity and related metabolic disorders : journal of the International Association for the Study of Obesity 1999; 23: 715-22. 11 Toth MJ, Sites CK, Poehlman ET. Hormonal and physiological correlates of energy expenditure and substrate oxidation in middle-aged, premenopausal women. The Journal of clinical endocrinology and metabolism 1999; 84: 2771-5. 12 Marra M, Scalfi L, Covino A, Esposito-Del Puente A, Contaldo F. Fasting respiratory quotient as a predictor of weight changes in non-obese women. International journal of obesity and related metabolic disorders : journal of the International Association for the Study of Obesity 1998; 22: 601-3. 13 Toth MJ, Gardner AW, Arciero PJ, Calles-Escandon J, Poehlman ET. Gender differences in fat oxidation and sympathetic nervous system activity at rest and during submaximal exercise in older individuals. Clinical science 1998; 95: 59-66. 14 Valtuena S, Salas-Salvado J, Lorda PG. The respiratory quotient as a prognostic factor in weight-loss rebound. International journal of obesity and related metabolic disorders : journal of the International Association for the Study of Obesity 1997; 21: 811-7. 15 Horber FF, Gruber B, Thomi F, Jensen EX, Jaeger P. Effect of sex and age on bone mass, body composition and fuel metabolism in humans. Nutrition 1997; 13: 524-34. 16 Nagy TR, Goran MI, Weinsier RL, Toth MJ, Schutz Y, Poehlman ET. Determinants of basal fat oxidation in healthy Caucasians. J Appl Physiol (1985) 1996; 80: 1743-8. 17 Rising R, Tataranni PA, Snitker S, Ravussin E. Decreased ratio of fat to carbohydrate oxidation with increasing age in Pima Indians. Journal of the American College of Nutrition 1996; 15: 309-12. 18 Roberts SB, Fuss P, Dallal GE, et al. Effects of age on energy expenditure and substrate oxidation during experimental overfeeding in healthy men. The journals of gerontology Series A, Biological sciences and medical sciences 1996; 51: B148-57. 19 Calles-Escandon J, Arciero PJ, Gardner AW, Bauman C, Poehlman ET. Basal fat oxidation decreases with aging in women. J Appl Physiol (1985) 1995; 78: 266-71. 20 Astrup A, Buemann B, Western P, Toubro S, Raben A, Christensen NJ. Obesity as an adaptation to a high-fat diet: evidence from a cross-sectional study. The American journal of clinical nutrition 1994; 59: 3505. 21 Seidell JC, Muller DC, Sorkin JD, Andres R. Fasting respiratory exchange ratio and resting metabolic rate as predictors of weight gain: the Baltimore Longitudinal Study on Aging. International journal of obesity and related metabolic disorders : journal of the International Association for the Study of Obesity 1992; 16: 667-74. 22 Schutz Y, Tremblay A, Weinsier RL, Nelson KM. Role of fat oxidation in the long-term stabilization of body weight in obese women. The American journal of clinical nutrition 1992; 55: 670-4. 23 Zurlo F, Lillioja S, Esposito-Del Puente A, et al. Low ratio of fat to carbohydrate oxidation as predictor of weight gain: study of 24-h RQ. The American journal of physiology 1990; 259: E650-E7. 24 Montalcini T, Lamprinoudi T, Morrone A, Mazza E, Gazzaruso C, Romeo S, Pujia A. Nutrients utilization in obese individuals with and without hypertriglyceridemia. Nutrients 2014; 6: 790-8. 25 Montalcini T, Lamprinoudi T, Gorgone G, Ferro Y, Romeo S, Pujia A. Subclinical cardiovascular damage and fat utilization in overweight/obese individuals receiving the same dietary and pharmacological interventions. Nutrients 2014; 6: 5560-71. 26 Galgani JE, Mizgier ML, Mari A, Ravussin E. Relationship between whole-body macronutrient oxidative partitioning and pancreatic insulin secretion/beta-cell function in non-diabetic humans. Metabolism: clinical and experimental 2014; 63: 1426-31. 27 Croci I, Byrne NM, Choquette S, et al. Whole-body substrate metabolism is associated with disease severity in patients with non-alcoholic fatty liver disease. Gut 2013; 62: 1625-33. 28 Montalcini T, Gazzaruso C, Ferro Y, Migliaccio V, Rotundo S, Castagna A, Pujia A. Metabolic fuel utilization and subclinical atherosclerosis in overweight/obese subjects. Endocrine 2013; 44: 380-5. 29 Korenaga K, Korenaga M, Teramoto F, et al. Clinical usefulness of non-protein respiratory quotient measurement in non-alcoholic fatty liver disease. Hepatology Research 2013; 43: 1284-94. 30 Ferro Y, Gazzaruso C, Coppola A, et al. Fat utilization and arterial hypertension in overweight/obese subjects. Journal of translational medicine 2013; 11: 159.


