Neural Networks for Regression Problems
advertisement
5 - Neural Networks for Regression
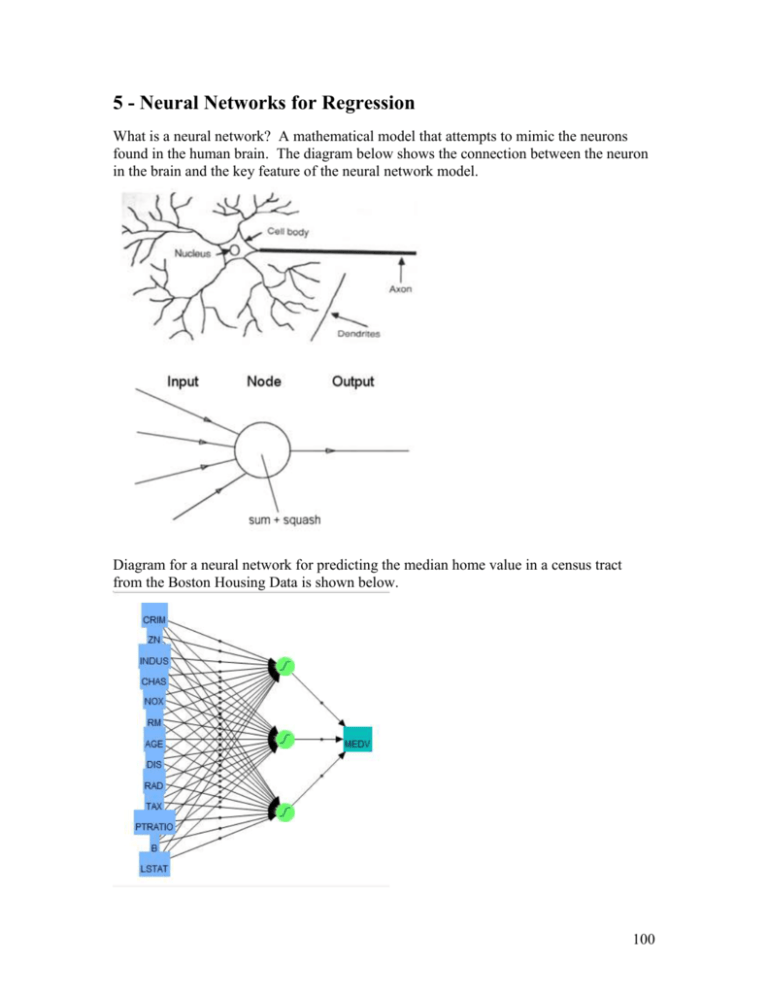
What is a neural network? A mathematical model that attempts to mimic the neurons
found in the human brain. The diagram below shows the connection between the neuron
in the brain and the key feature of the neural network model.
Diagram for a neural network for predicting the median home value in a census tract
from the Boston Housing Data is shown below.
100
The neural network regression model looks like this:
𝑝
𝑌 = 𝛼 + ∑ 𝑤ℎ 𝜙ℎ (𝛼ℎ + ∑ 𝑤𝑖ℎ 𝑋𝑖 ))
ℎ
𝑖=1
where 𝑌 = 𝐸(𝑌|𝑿) . This neural network model has 1 hidden layer but it is possible to
have additional hidden layers.
The 𝜙(𝑧) functions used are usually chosen from the following choices.
Activation Functions - 𝝓(𝒛)
The hidden layer squash function, 𝜙ℎ , that is used by JMP is the hyperbolic tangent
function and I believe nnet in R uses the logistic activation function for the hidden
layers. For regression problems, it is common to include a skip-layer to the neural
network. Also for regression problems it is important that the final outputs be linear as
we don’t want to constrain the predictions to be between 0 and 1. I simple diagram of a
skip-layer neural network is shown below.
The equation for the skip-layer neural network for regression is shown below.
𝑝
𝑝
𝑌 = 𝛼 + ∑ 𝛽𝑖 𝑋𝑖 + ∑ 𝑤ℎ 𝜙ℎ (𝛼ℎ + ∑ 𝑤𝑖ℎ 𝑋𝑖 ))
𝑖=1
ℎ
𝑖=1
101
It should be clear that these models are highly parameterized and thus will tend to over fit
the training data. Cross-validation is therefore critical to make sure that the predictive
performance of the neural network model is adequate.
The library MASS contains a basic neural network function, nnet().
Help File for nnet command in MASS library.
Fit Neural Networks
Description:
Fit single-hidden-layer neural network, possibly with skip-layer connections.
Usage:
nnet(x, ...)
## S3 method for class 'formula':
nnet(formula, data, weights, ...,
subset, na.action = na.fail, contrasts = NULL)
## Default S3 method:
nnet(x, y, weights, size, Wts, mask,
linout = FALSE, entropy = FALSE, softmax = FALSE,
censored = FALSE, skip = FALSE, rang = 0.7, decay = 0,
maxit = 100, Hess = FALSE, trace = TRUE, MaxNWts = 1000,
abstol = 1.0e-4, reltol = 1.0e-8, ...)
Arguments:
formula: A formula of the form 'class ~ x1 + x2 + ...'
x: matrix or data frame of 'x' values for examples.
y: matrix or data frame of target values for examples.
weights: (case) weights for each example - if missing defaults to 1.
size: number of units in the hidden layer. Can be zero if there are only skip-layer units.
data: Data frame from which variables specified in 'formula' are
preferentially to be taken.
subset: An index vector specifying the cases to be used in the training sample.
(NOTE: If given, this argument must be named.)
na.action: A function to specify the action to be taken if 'NA's are
found. The default action is for the procedure to fail. An
alternative is na.omit, which leads to rejection of cases
with missing values on any required variable. (NOTE: If
given, this argument must be named.)
linout: switch for linear output units. Default logistic output units. (must be true for regression!)
entropy: switch for entropy (= maximum conditional likelihood) fitting. Default by least-squares.
102
skip: switch (T or F) to add skip-layer connections from input to output.
decay: parameter for weight decay.
Default 0.
maxit: maximum number of iterations. Default 100.
MaxNWts: The maximum allowable number
intrinsic limit in the code,
probably allow fits that are
(and perhaps uninterruptable
of weights. There is no
but increasing 'MaxNWts' will
very slow and time-consuming
under Windows).
abstol: Stop if the fit criterion falls below 'abstol', indicating an
essentially perfect fit.
reltol: Stop if the optimizer is unable to reduce the fit criterion
by a factor of at least '1 - reltol'.
...: arguments passed to or from other methods.
Details:
If the response in 'formula' is a factor, an appropriate classification network is constructed; this has one
output and entropy fit if the number of levels is two, and a number of outputs equal to the number of
classes and a softmax output stage for more levels. If the response is not a factor, it is passed on
unchanged to 'nnet.default'.
Optimization is done via the BFGS method of 'optim'.
Value:
object of class '"nnet"' or '"nnet.formula"'. Mostly internal
structure, but has components
wts:
value:
fitted.values:
residuals:
the best set of weights found
value of fitting criterion plus weight decay term.
the fitted values for the training data.
the residuals for the training data.
Example 5.1: Boston Housing Data
>
>
>
>
set.seed(5555) search algorithm for weights has randomness to it.
library(nnet)
attach(Boston.working)
names(Boston.working)
[1] "CMEDV"
[12] "B"
"CRIM"
"LSTAT"
"ZN"
"NOX"
"INDUS"
"CHAS"
"RM"
"AGE"
"DIS"
"RAD"
"TAX"
"PTRATIO"
> y <- log(CMEDV)
> bos.x <- Boston.working[,-1] remove 1st column which is the response
> bos.nn= nnet(bos.x,y,size=10,linout=T,skip=T,maxit=10000,decay=.001)
# weights: 164
initial value 1119963.572209
iter 10 value 71854.776358
iter 20 value 42006.282808
iter 30 value 508.046874
iter 40 value 140.679111
iter 50 value 24.874044
iter 60 value 19.625465
iter 70 value 19.307036
103
iter 80 value 18.840288
iter 90 value 18.618220
iter 100 value 18.504744
iter 110 value 18.454630
iter 120 value 18.142266
iter 130 value 17.891147
iter 140 value 17.717283
iter 150 value 17.701426
iter 160 value 17.690550
final value 17.681140
converged
Here the following options have been chosen in fitting bos.nn:
10 units for the hidden layer
linear output (necessary for regression problems) (linout = T)
use a neural network with skip layer units (skip = T)
set maximum number of iterations to a large number to “guarantee” convergence.
decay = .0001 or .001 generally works “better” than the default = 0.
> summary(bos.nn)
a 13-10-1 network with 164 weights
options were - skip-layer connections
linear output units
decay=1e-04
Weights:
Recall the skip-layer neural network regression model looks like this:
𝑝
𝑝
𝑌 = 𝛼 + ∑ 𝛽𝑖 𝑋𝑖 + ∑ 𝑤ℎ 𝜙ℎ (𝛼ℎ + ∑ 𝑤𝑖ℎ 𝑋𝑖 ))
𝑖=1
ℎ
𝑖=1
What are the following weights/parameters from the output above?
𝑤94 =
𝑤19 =
𝑤81 =
𝛼10 =
𝛼5 =
𝛼=
𝑤1 =
𝑤10 =
𝛽9 =
104
> trendscatter = function (x, y, f = 0.5) {
xname <- deparse(substitute(x))
yname = deparse(substitute(y))
xs <- sort(x, index = T)
x <- xs$x
ix <- xs$ix
y <- y[ix]
trend <- lowess(x, y, f)
e2 <- (y - trend$y)^2
scatter <- lowess(x, e2, f)
uplim <- trend$y + sqrt(abs(scatter$y))
lowlim <- trend$y - sqrt(abs(scatter$y))
plot(x, y, pch = 1, xlab = xname, ylab = yname,
main = paste("Plot of",yname, "vs.", xname, "
lines(trend, col = "Blue")
lines(scatter$x, uplim, lty = 2, col = "Red")
lines(scatter$x, lowlim, lty = 2, col = "Red")
}
(loess+/-sd)"))
Note: This function is in the function library I sent you at the start of the course.
> trendscatter(y,fitted(bos.nn))
> cor(y,fitted(bos.nn))^2
[,1]
[1,] 0.9643876908
105
Probably the best R-squares from all the modern regression methods we have examined, however
this model almost certainly over fits the training data. If we think of the weights as parameters to
be estimated this model essentially uses 164 degrees of freedom! Cross-validation or an estimate
of prediction squared error (RMSEP) is a must.
MCCV Function for Regression Neural Network Models
> results = nnet.cv(bos.x,y,bos.nn,size=10,B=25)
> summary(results)
Min. 1st Qu. Median
Mean 3rd Qu.
Max.
0.1516 0.1860 0.2218 0.2203 0.2359 0.3180
> nnet.cv
= function(x,y,fit,p=.667,B=100,size=3,
decay=fit$decay,skip=T,linout=T,maxit=10000)
{
n <- length(y)
cv <- rep(0,B)
for (i in 1:B) {
ss <- floor(n*p)
sam <- sample(1:n,ss,replace=F)
fit2 <-nnet(x[sam,],y[sam],size=size,linout=linout,skip=skip,
decay=decay,maxit=maxit,trace=F)
ynew <- predict(fit2,newdata=x[-sam,])
cv[i] <- mean((y[-sam]-ynew)^2))
}
cv
}
5 hidden nodes (h = 5)
> results = nnet.cv(bos.x,y,bos.nn,size=5,B=25)
> summary(results)
Min.
1st Qu.
Median
Mean
3rd Qu.
Max.
0.02669253 0.03166354 0.03459947 0.04334212 0.04276061 0.17556480
> summary(sqrt(results))
Min.
1st Qu.
Median
Mean
3rd Qu.
Max.
0.1633785 0.1779425 0.1860093 0.2019261 0.2067864 0.4190045
> sqrt(mean(results))
[1] 0.2081877028
Predicted values vs. Actual
(h = 5)
106
3 hidden nodes (h = 3)
> results = nnet.cv(bos.x,y,bos.nn,size=3,B=25)
> summary(results)
Min.
1st Qu.
Median
Mean
3rd Qu.
Max.
0.02341298 0.03163014 0.03438403 0.03662633 0.04219499 0.05767779
> summary(sqrt(results))
Min.
1st Qu.
Median
Mean
3rd Qu.
Max.
0.1530130 0.1778486 0.1854293 0.1902643 0.2054142 0.2401620
> sqrt(mean(results))
[1] 0.1913800706
Naïve estimate of RMSEP = √𝑅𝑆𝑆/𝑛
> sqrt(mean(resid^2))
[1] 0.076972094
Example 5.2: CA Homes
These data come from a study of median home values in census tracts in California.
> head(CAhomes) displays the first 6 rows of a data frame in R.
MedHP MedInc Hage TotRms TotBeds Pop NumHH
Lat
1 452600 8.3252
41
880
129 322
126 37.88
2 358500 8.3014
21
7099
1106 2401 1138 37.86
3 352100 7.2574
52
1467
190 496
177 37.85
4 341300 5.6431
52
1274
235 558
219 37.85
5 342200 3.8462
52
1627
280 565
259 37.85
6 269700 4.0368
52
919
213 413
193 37.85
Long
-122.23
-122.22
-122.24
-122.25
-122.25
-122.25
The response is the median home price/value (MedHP) and the potential predictors are:
MedInc – median household income in the census tract
Hage – median home age in the census tract.
TotRms – total number of rooms in all the homes combined in the census tract.
TotBeds – total number of bedrooms in all the homes combined in the census tract.
Pop – number of people in the census tract.
NumHH – total number of households in the census tract.
Lat – latitude of the centroid of the census tract
Long – longitude of the centroid of the census tract.
Presented below are some plots of these data:
> attach(CAhomes)
> Statplot(MedHP)
What interesting features do you see in the response?
107
> pairs.plus(CAhomes) TAKES A LONG TIME TO RUN!
Using Bubble Plots in JMP (under Graph menu)
Here circles are proportional in size to the response and the color denotes the median household income.
108
Without doing any preprocessing of the response and/or the predictors we can fit a neural network to
predict the median home value in a census tract using the census tract level predictors.
> X = CAhomes[,-1]
> y = CAhomes[,1]
> ca.nnet = nnet(X,y,size=6,linout=T,skip=T,maxit=10000,decay=.001)
# weights: 69
initial value 1155054841839622.500000
iter 10 value 180176476664334.437500
iter 20 value 143205254195815.500000
iter 30 value 94815590611921.406250
iter 40 value 94805464731121.609375
iter 50 value 94602493096295.328125
iter 60 value 94434274690428.843750
iter 70 value 94383275084861.390625
iter 80 value 94373838660981.296875
iter 90 value 94352897115920.890625
iter 100 value 94344043542937.640625
iter 110 value 94298251944650.421875
iter 120 value 94099849636283.406250
iter 130 value 94036450323079.875000
iter 140 value 93797377684854.312500
iter 150 value 93697914437649.546875
iter 160 value 93433613476027.984375
iter 170 value 93398377336154.593750
iter 180 value 92980400623365.890625
iter 190 value 92512810126913.015625
iter 200 value 92002250948180.640625
iter 210 value 91850999131736.437500
iter 220 value 91456684623887.828125
iter 230 value 91392579048187.343750
iter 240 value 91064866712578.375000
iter 250 value 90991063375381.437500
iter 260 value 90873991849937.062500
iter 270 value 90849965960191.328125
iter 270 value 90849965960191.328125
iter 280 value 90825629314687.984375
iter 290 value 90816126987550.437500
iter 300 value 90815506792120.015625
iter 310 value 90814395800305.937500
final value 90814373948204.828125
converged
> summary(ca.nnet)
a 8-6-1 network with 69 weights
options were - skip-layer connections
b->h1
i1->h1
i2->h1
-24.18
0.36
0.05
b->h2
i1->h2
i2->h2
-0.08
0.01
0.13
b->h3
i1->h3
i2->h3
-0.05
-1.67
-6.59
b->h4
i1->h4
i2->h4
0.01
0.15
0.88
b->h5
i1->h5
i2->h5
-197.76
-941.14
-5895.91
b->h6
i1->h6
i2->h6
82.55
899.00
18191.04
b->o
h1->o
h2->o
-1170268.38 -1169378.71 -1170268.48
i3->o
i4->o
i5->o
4.26
4.85
-47.39
linear output units decay=0.001
i3->h1
i4->h1
i5->h1
0.00
0.00
0.00
i3->h2
i4->h2
i5->h2
0.09
-0.08
0.01
i3->h3
i4->h3
i5->h3
-1.03
0.06
-1.28
i3->h4
i4->h4
i5->h4
1.20
0.29
0.66
i3->h5
i4->h5
i5->h5
3742.46
-1627.08
7277.02
i3->h6
i4->h6
i5->h6
-8367.98
81686.31
-70333.62
h3->o
h4->o
h5->o
-0.04
-3066.42
12057.91
i6->o
i7->o
i8->o
126.99
-46233.12
-42645.55
i6->h1
0.00
i6->h2
0.13
i6->h3
0.05
i6->h4
0.52
i6->h5
-1585.20
i6->h6
106027.65
h6->o
40423.22
i7->h1
-0.44
i7->h2
0.13
i7->h3
-1.79
i7->h4
4.81
i7->h5
-7098.73
i7->h6
3002.23
i1->o
43524.35
i8->h1
-0.35
i8->h2
-0.11
i8->h3
5.30
i8->h4
-16.20
i8->h5
23764.30
i8->h6
-9972.07
i2->o
1906.04
109
> plot(y,fitted(ca.nnet))
> cor(y,fitted(ca.nnet))
[,1]
[1,] 0.8184189
> cor(y,fitted(ca.nnet))^2
[,1]
[1,] 0.669809 R2 is 66.98%
Try using log(MedHP) as the response…
> logy = log(y)
> ca.nnet = nnet(X,logy,size=6,linout=T,skip=T,maxit=10000,decay=0.01)
# weights: 69
initial value 53507862150.151787
iter 10 value 4629141470.195857
iter 20 value 995924050.679593
... … ……………
iter 750 value 1776.152891
iter 760 value 1776.127757
iter 770 value 1776.125791
iter 780 value 1776.124947
final value 1776.124764
converged
110
> plot(logy,fitted(ca.nnet))
> cor(logy,fitted(ca.nnet))
[,1]
[1,] 0.8579109
> cor(logy,fitted(ca.nnet))^2
[,1]
[1,] 0.7360111
A fancy plot in R – (not as easy as JMP)
> price.deciles = quantile(CAhomes$MedHP,0:10/10)
> cut.prices = cut(CAhomes$MedHP,price.deciles,include.lowest=T)
> plot(Long,Lat,col=grey(10:2/11)[cut.prices],pch=20,xlab=”Longitude”,ylab=”Latitude”)
111
Neural Networks in JMP
To fit a neural network in JMP select the Neural option from within the Analyze
> Modeling menu as shown below.
The model dialog box for fitting a neural network is shown below.
The response (Y) goes in
the Y,Response box and
maybe either continuous
for a regression problem or
categorical for a
classification problem. The
potential predictors go in
the X,Factor box and maybe
a mixture of variable types.
The neural network model building platform is shown on the following page.
There are numerous options that can be set which control different aspects of the
model fitting process such as the number of hidden layers (1 or 2), type of
“squash” function, cross-validation proportion, robustness (outlier protection),
regularization (similar to ridge and Lasso), predictor transformations, and
number of models to fit (which protects against the randomness of the
optimization algorithm.
112
Holdback Proportion – fraction to use in test set
(33.33% by default)
Hidden Layer Structure – for two hidden layer
networks, the Second layer is actual the first
layer coming from the predictors. The “squash”
or activation functions are the hyperbolic
tangent, linear or Gaussian.
Boosting – will be discussed later in the course.
Transform Covariates – checking this will
perform transformations of continuous
predictors to approximate normality.
Robust Fit – will provide protection against
outlier by minimizing the sum of absolute
residuals, rather than the squared residuals.
Penalty Method – includes a penalty as in regularized/shrinkage regression methods we have examined
previously, the penalty options are:
Squared = ∑ 𝛽𝑗2 ~ analagous to ridge regression
Absolute = ∑ |𝛽𝑗 | ~ analogous to Lasso regression
Weight Decay = ∑ 𝛽𝑗2 /(1 + 𝛽𝑗2 )
No Penalty – there is no penalty on estimated weights.
Absolute and Weight Decay tend to work well when the number of potential predictors is large as it tends to
“0” some out.
Number of Tours – the number of times to fit the model to find the “optimal” weights. Due to the fact the
algorithm utilizes some randomness in fitting the model, you will not get the results fit every time even when
all the aspects of the fitting process are the same. JMP returns the model with best fit amongst those found.
As an example of fitting neural networks in JMP we again consider the California
census tract home value data.
113
Below are some neural networks to these data. I did not give much thought into
these models and I am sure there are other viable models for these data. The
basic model diagram of the models summarized below is shown below.
Here I have used two hidden layers in the neural network, the first consists of 6
nodes and second consists of 4 nodes. At each node the activation function is
given by:
1 − 𝑒 −2𝑧
𝜙(𝑧) = tanh(𝑧) =
1 + 𝑒 −2𝑧
The choice of 6 and 4 was completely arbitrary but the results achieved seem
reasonable as we shall see below.
114
The basic form of all models are the same, I did use some of the optional setting
to fine tune the fitting process.
Model 1 - Base model fit using the
default settings.
Model 2 - Same model as above with
Transform Covariates checked.
Model 3 – Same model as those
above with both Transform
Covariates and Robust Fit options
checked.
Plot of Actual vs. Predicted for Training and Validation/Test Sets
115
Plot of Residuals vs. Predicted for Training and Validation/Test Sets
If consider Model 3 to be our final model, then we can use JMP to explore the
fitted equation interactively and save certain results of the fit.
Diagram – displays diagram of neural network.
Show Estimates – shows the weights/coefficients
using a convention similar to R.
Profiler – explore the fitted surface using
univariate sliders.
Contour Profiler – explore the fitted “surface”
using a contour plot as a function of two
predictors at a time.
Surface Profiler – display the fitted “surface”
using a 3-D surface a function of two predictors
at a time.
Save Formulas – save formulae for hidden layer
nodes and the response. They can be used to
make future predictions.
Save Transformed Covariates – save the
covariate transformations found before fitting
neural network.
Surface Profiler
116
Profiler
Contour Profiler
117
Transformed Covariates – each has transformed to be approximately normally
distributed prior to fitting the neural network.
118
