MS Word - STRIDE
advertisement
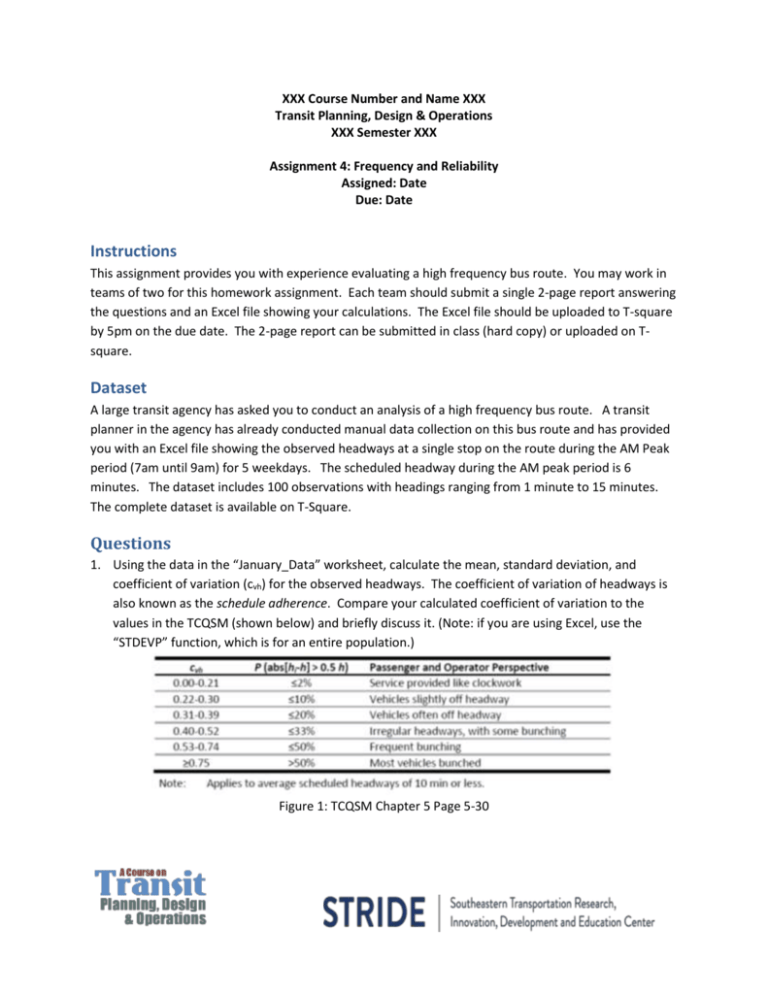
XXX Course Number and Name XXX Transit Planning, Design & Operations XXX Semester XXX Assignment 4: Frequency and Reliability Assigned: Date Due: Date Instructions This assignment provides you with experience evaluating a high frequency bus route. You may work in teams of two for this homework assignment. Each team should submit a single 2-page report answering the questions and an Excel file showing your calculations. The Excel file should be uploaded to T-square by 5pm on the due date. The 2-page report can be submitted in class (hard copy) or uploaded on Tsquare. Dataset A large transit agency has asked you to conduct an analysis of a high frequency bus route. A transit planner in the agency has already conducted manual data collection on this bus route and has provided you with an Excel file showing the observed headways at a single stop on the route during the AM Peak period (7am until 9am) for 5 weekdays. The scheduled headway during the AM peak period is 6 minutes. The dataset includes 100 observations with headings ranging from 1 minute to 15 minutes. The complete dataset is available on T-Square. Questions 1. Using the data in the “January_Data” worksheet, calculate the mean, standard deviation, and coefficient of variation (cvh) for the observed headways. The coefficient of variation of headways is also known as the schedule adherence. Compare your calculated coefficient of variation to the values in the TCQSM (shown below) and briefly discuss it. (Note: if you are using Excel, use the “STDEVP” function, which is for an entire population.) Figure 1: TCQSM Chapter 5 Page 5-30 2. Because this is high frequency bus service, we assume that passengers arrive at this bus stop randomly. Therefore, the expected passenger wait time (tw) can be calculated as follows: tw = 0.5 h * (1 + cvh2) where h is the average headway (minutes) and cvh is the coefficient of variation of headways. Apply this formula to calculate the expected passenger waiting time, and compare this to the scheduled passenger waiting time (i.e. half of the scheduled headway) for the “January_Data.” 3. Because many measures of service reliability can be difficult to explain to passengers (e.g. coefficient of variation), you propose a new service standard that focuses on “big gaps” in bus service. You propose that no more than 10% of passengers should have to wait more than H+2 minutes, where H is the scheduled headway (6 minutes). Assuming equal passenger boardings on all observed trips, does your route meet this service standard? To answer this question, determine the percentage of observed headways that meet the standard for the “January_Data.” 4. The transit agency implements a number of real-time control strategies to improve reliability on this route. A few weeks later, additional headway data are collected (“February_Data”) for the same route, again during the AM Peak period on five weekdays. Your manager asks you if the control strategies were successful in improving reliability on the route. To answer this question, calculate the mean, standard deviation, and coefficient of variation (cvh) for the observed headways. Compare the schedule adherence to your answer from question 1 and briefly discuss the implications. 5. Your manager also liked your idea for the “big gaps” service standard, and she asks you to determine if the new real-time control strategies helped reduce the number of “big gaps” on this route. To answer this question, calculate the percentage of observed headways that meet the standard of H+2 minutes. Compare this to your answer from question 3. Reference: This homework is adapted from Professor Peter Furth at Northeastern University.
