Getting Worldclim and IPCC Data Mapped
advertisement

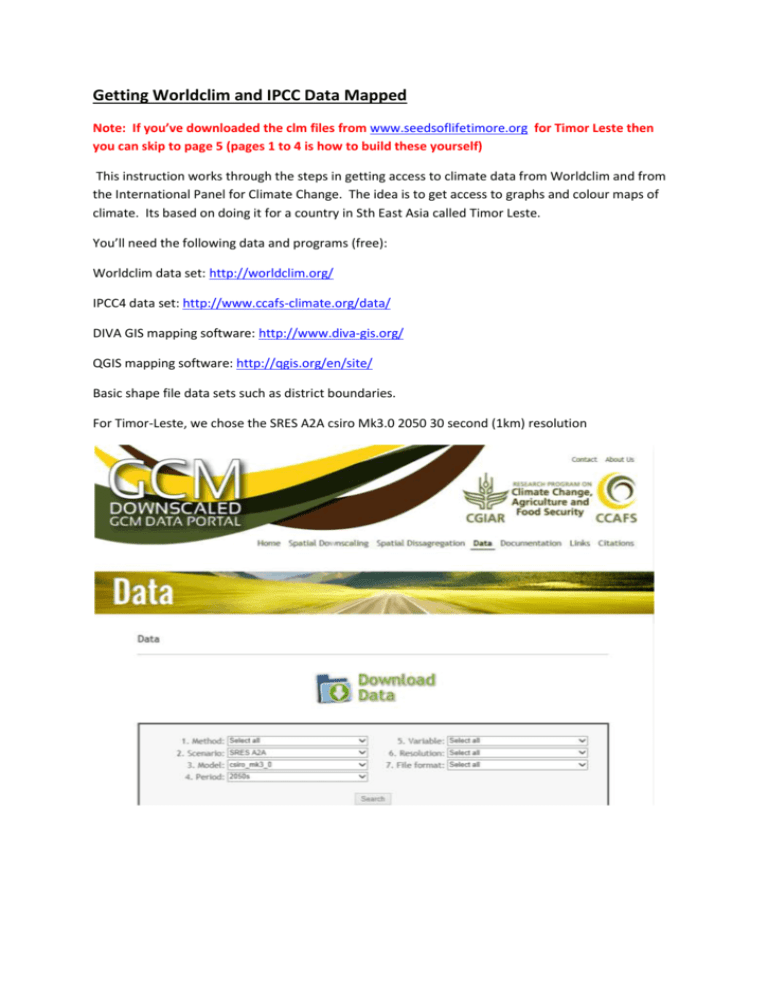
Getting Worldclim and IPCC Data Mapped Note: If you’ve downloaded the clm files from www.seedsoflifetimore.org for Timor Leste then you can skip to page 5 (pages 1 to 4 is how to build these yourself) This instruction works through the steps in getting access to climate data from Worldclim and from the International Panel for Climate Change. The idea is to get access to graphs and colour maps of climate. Its based on doing it for a country in Sth East Asia called Timor Leste. You’ll need the following data and programs (free): Worldclim data set: http://worldclim.org/ IPCC4 data set: http://www.ccafs-climate.org/data/ DIVA GIS mapping software: http://www.diva-gis.org/ QGIS mapping software: http://qgis.org/en/site/ Basic shape file data sets such as district boundaries. For Timor-Leste, we chose the SRES A2A csiro Mk3.0 2050 30 second (1km) resolution Accessing the Worldclim Climate Data is a 3 step process: 1. Getting the BIL files from Worldclim (or ASC files from CCAFS site) 2. Importing/converting these into GRD files in DIVA-GIS 3. Creating CLM files in DIVA-GIS 1. Getting the BIL files from Worldclim Navigate to the spot where you can download 30 sec data as tiles. The tile for Timor Leste is 310. Download all the 310 tile data. Unzip it (you can download winzip for this) Note that the 2.5min data from the CCAFS site can be downloaded as ASC files to be imported into DIVA-GIS. This should give you a list of files arranged in folders: 2. Importing/converting these into GRD files in DIVA-GIS Open DIVA-GIS and import each of the BIL files into GRD format a. Data – import to Grid file – multiple files b. Select BIL type (Select Arc ASCII for the CCAFS 2.5 min data) c. Click on add file and browse to your files, you can select all the prec (precipitation) files in the prec file and import, keep going until all the temp, bio, alt files are imported. If it freezes, try doing less files. d. Create a new folder for the output files and select it in the output file section. e. Click apply and wait – they are big files to process. 3. Creating CLM files in DIVA-GIS This step generates the clm files which the DIVA-GIS program refers to for climate data. A critical trick at this point is to make sure that all the GRD and GRI files that have just been created have the correct name. If they are not correctly named then the DIVA-GIS program won’t process them. For example, the GRD file you create might look like this: “prec1_310.grd” You will need to change this file name so it looks like this: “prec_1.grd” This takes a bit of fussing around because there are 12 GRD files and 12 GRI files for rain, Tmax and Tmin. If you’re good at your maths, thats 72 files that need to be renamed so go to it! Once renaming is done, go back into the DIVA-GIS program: a. Click on Data – Climate – Make CLM files b. Browse to where all the GRD files are located. You should see them appear in the middle top box. Note all the file names, I think they must look like that. Note that the “Selected Files” boxes will still be empty at this stage – just go on to step c. c. Fix the File Prefixes so that you’ve got “tmin_”, “tmax_” and “prec_” (not “rain” and make sure all the underscores are there) as in the screenshot. d. Leave the other boxes blank. Alt should be in the Altitude mask box. (Note: if you didn’t get an alt file, you can copy one of the other 36 grd/gri files and rename them as alt.grd and alt.gri to fool the program. It just means the alt data won’t be relevant) e. Click on “Files” and you should see all the grd files listed in the empty boxes under selected files. If this doesn’t happen its probably because you didn’t rename the files correctly, go back to the red writing! It should now look like the image below: f. Now click “OK”. The files automatically get created (give it time, allow it to freeze a little) and are dumped in the folder with all the grd/gri files. If you tried to do the whole world at 30sec it might freeze over forever (this could possibly be worth trying if global warming really gets going ... heh ... heh) g. At this point, I go and grab those clm files and put them in their own neat little folder in an important place. You’ll need to refer to them in DIVA-GIS a bit later. Using Climate Data in DIVA-GIS 1. Open DIVA GIS and add district and town layers so you know where you are. 2. You can now tell DIVA to refer to climate data: click on Tools – Options and click on the Climate tab in the Options window. 3. Click on Folder and navigate to the folder that has your climate data, this should be a bunch of clm and cli files. You can only refer to one set of climate data at a time. DIVA refers to this data to create graphs using the Climate Button (white C in black circle) or to create maps of temperature or rainfall. 4. Click OK, Click Apply . If you have done the right thing, all the appropriate data is automatically filled in to all the boxes in the window. Click “OK”. 5. The climate data now exists within the DIVA-GIS project. You can bring up data from any location by clicking on the black and white “C” icon (this is the climate data selector tool) and click anywhere on land. A table should come up showing precipitation, Tmax, Tmin, graph and other climate data. 6. This data can be simply moved to excel by clicking on “copy” and then in excel, “paste” This is a great way of getting climate data for places where weather is not measured. On a side note, if you need this generated as daily weather data then you can do that easily at the “MarkSim” website. Its very easy to use (but remember that none of this is real – only modelled). MAPPING Climate Data We all like pretty maps, so here’s some clues on how to do it... The DIVA program refers to the CLM files to generate maps of rainfall and temperature. All of these maps can be loaded into the program and switched on and off but remember that the climate data from the climate selector will always refer to the climate preselected through the “tools”- “options” pathway, not from the climate layer. 1. To map the data, click Data – Climate – Map 2. Change output to precipitation or temperature etc. 3. Give the file a name and location by clicking on File button 4. Now some of your data such as Worldclim may include the whole world. I select the area of interest by drawing a rectangle over it. Click on Draw Rectangle and drag it over Timor Leste. 5. Click apply and close, hopefully the map appears in DIVA. Below is the current Worldclim 30 second resolution rainfall map with “no data” set as transparent. You can make maps of temperature as well by selecting the temperature variable in output. For further processing and use in other mapping software such as QGIS we can export this map as a asc file. 6. Click on Data on top bar then “Export to Grid File” – single file and ESRI ASCII. Set your input and output files in right locations with names and click Apply. Note the option here of creating a shapefile as points which may allow processing in QGIS to make a smooth colour transition rather than pixellated look. Note also the groovy option to export as Google Earth .kmz file so it overlays in google earth and goes all 3D on you – great for sharing with the non-GIS community Check that out, and I’m not really a pro at this sort of thing. If you’ve read all the way to here and found this document helpful then send me a little cheer-me-up message to samuel.bacon@seedsoflifetimor.org Cheers, Samuel 11/12/13


