UNESCO Institute for Statistics Data Validation Use Cases
advertisement
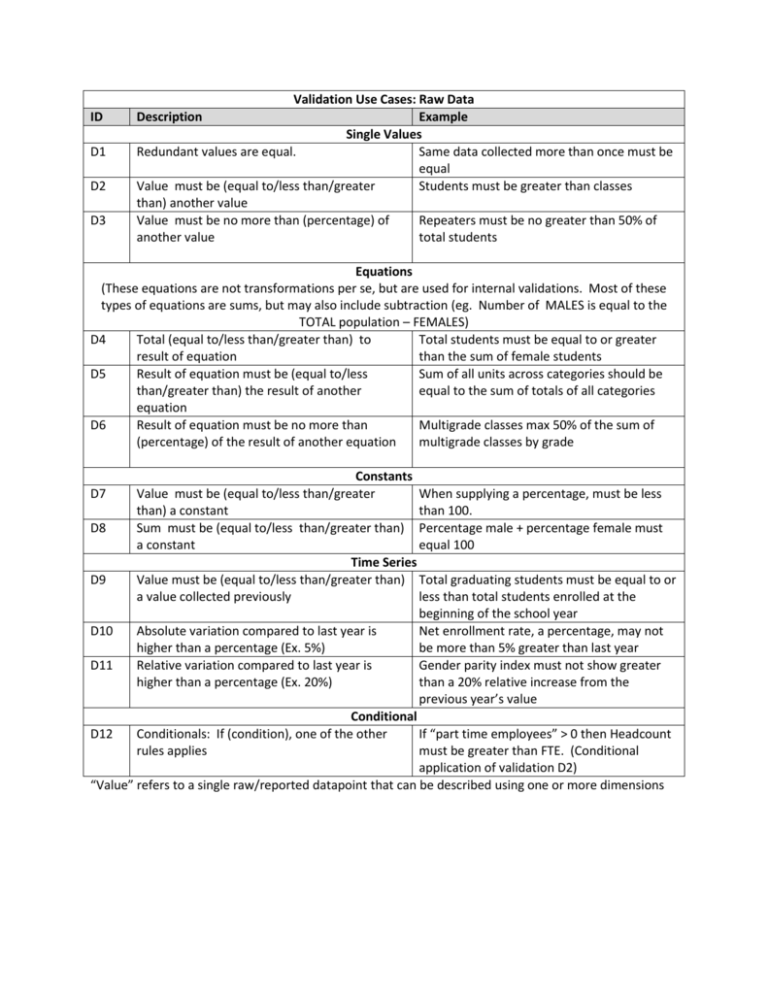
ID D1 D2 D3 Validation Use Cases: Raw Data Description Example Single Values Redundant values are equal. Same data collected more than once must be equal Value must be (equal to/less than/greater Students must be greater than classes than) another value Value must be no more than (percentage) of Repeaters must be no greater than 50% of another value total students Equations (These equations are not transformations per se, but are used for internal validations. Most of these types of equations are sums, but may also include subtraction (eg. Number of MALES is equal to the TOTAL population – FEMALES) D4 Total (equal to/less than/greater than) to Total students must be equal to or greater result of equation than the sum of female students D5 Result of equation must be (equal to/less Sum of all units across categories should be than/greater than) the result of another equal to the sum of totals of all categories equation D6 Result of equation must be no more than Multigrade classes max 50% of the sum of (percentage) of the result of another equation multigrade classes by grade Constants D7 Value must be (equal to/less than/greater When supplying a percentage, must be less than) a constant than 100. D8 Sum must be (equal to/less than/greater than) Percentage male + percentage female must a constant equal 100 Time Series D9 Value must be (equal to/less than/greater than) Total graduating students must be equal to or a value collected previously less than total students enrolled at the beginning of the school year D10 Absolute variation compared to last year is Net enrollment rate, a percentage, may not higher than a percentage (Ex. 5%) be more than 5% greater than last year D11 Relative variation compared to last year is Gender parity index must not show greater higher than a percentage (Ex. 20%) than a 20% relative increase from the previous year’s value Conditional D12 Conditionals: If (condition), one of the other If “part time employees” > 0 then Headcount rules applies must be greater than FTE. (Conditional application of validation D2) “Value” refers to a single raw/reported datapoint that can be described using one or more dimensions Validation Use Cases: Transformations/Indicators1 ID Description Example T1 Result must be (greater than/less than) a Resulting percentage should be between 0 threshold and 100 T2 Result must be (greater than/less than) another Mark Net Enrollment Rate for ISCED1 as dirty result if it is greater than the Adjusted Net Enrollment Rate for ISCED1 T3 If result passes threshold (see rule T1) mark Mark net enrollment rate dirty if the dependant transformations dirty. associated capping factor is > 1.1 T4 Result cannot be nil Mark school life expectancy dirty if nil T5 Mark result dirty if related result from previous Mark Apparent Intake Rate for ISCED1, Male year dirty dirty if Survival rate for ISCED1, Male from the previous year is dirty T6 Status may be viral between related results Net enrollment rate for a specific year/country will get marked as dirty if gross enrollment ratio is dirty. This rule allows for cascading validation (marking one transformation as dirty and having all related transformations flagged as dirty). 1 UIS terminology: data that has been transformed via calculation results in an indicator “Dirty” data – data that is reported but whose quality is dubious. This data should not be published but may be exchanged for internal use. “Result” refers to a single value resulting from a transformation that can be described using one or more dimensions. NOTE 1: Two types of errors should exist for failed validations: W- Warning – will flag the value or result as problematic, but will not mark it as “dirty” so the value/result may still be used in further transformations or publications. E- Error – will flag a value/result as invalid. This value/result will be marked as “dirty” and should not be used in any further calculations or publications. NOTE 2: All the above operations can be performed on any dimension or combination of dimensions of the cube. Example: “Total graduating students must be equal to or less than total students enrolled at the beginning of the school year”. The data value for graduating students must be compared to the prior year’s enrolled students, so the “<=” operator must be able to compare on data points that differ on 2 dimensions: TYPE (graduating versus enrolled) and TIME (current year versus prior year). NOTE 3: More complicated validations can be accommodated by having multiple checks on the same datapoint/value. For example: Value C is the count of values in the intersection between groups A and B. Therefore, value C needs to be less than or equal to both A and B. In this case, we would have 2 validation rules (D2) which states: “C must be less than or equal to A” and another rule which states “C must be less than or equal to B”. NOTE 4: It may be useful to be able to specify “AND” in validations, so that a specific value or result would need to fail multiple validations before being flagged as problematic. An “OR” should not be required as it would be the default case (error will be flagged as soon as it fails any validation). NOTE 5: It would be useful to be able to use standard functions when processing values or results. For example, if a value must be between the MIN and MAX values of a particular list. “Total students in a specific classroom must be between the least and most populated classrooms for a specific school”. A >= min(B) and A<=max(B) where A is the number of students in a specific classroom, and B is the list of the populations of each classroom in the school. Several mathematical functions could be useful in this capacity (MIN, MAX, AVG, ABS). It may not be practical to have these functions in the first version of the validation rules as they will likely add significant complexity to the rules definition. For any comments or questions, please contact Marc Bouffard at the UNESCO Institute for Statistics (m_bouffard@unesco.org)
