File
advertisement
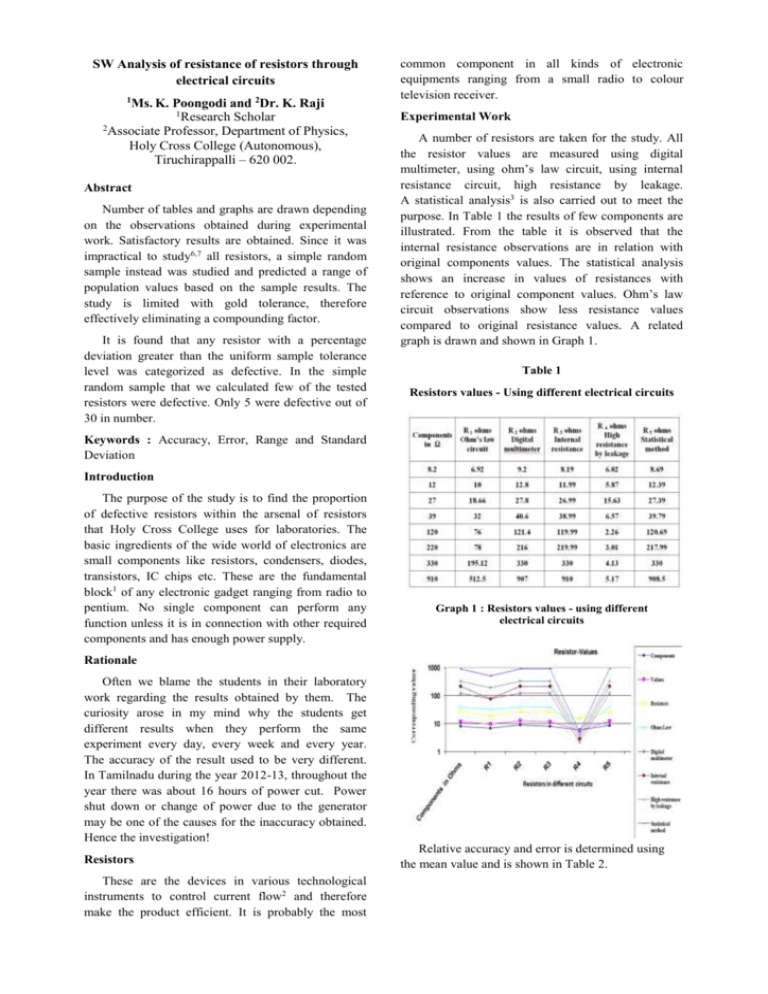
SW Analysis of resistance of resistors through electrical circuits 1 Ms. K. Poongodi and 2Dr. K. Raji 1 Research Scholar 2 Associate Professor, Department of Physics, Holy Cross College (Autonomous), Tiruchirappalli – 620 002. Abstract Number of tables and graphs are drawn depending on the observations obtained during experimental work. Satisfactory results are obtained. Since it was impractical to study6,7 all resistors, a simple random sample instead was studied and predicted a range of population values based on the sample results. The study is limited with gold tolerance, therefore effectively eliminating a compounding factor. It is found that any resistor with a percentage deviation greater than the uniform sample tolerance level was categorized as defective. In the simple random sample that we calculated few of the tested resistors were defective. Only 5 were defective out of 30 in number. common component in all kinds of electronic equipments ranging from a small radio to colour television receiver. Experimental Work A number of resistors are taken for the study. All the resistor values are measured using digital multimeter, using ohm’s law circuit, using internal resistance circuit, high resistance by leakage. A statistical analysis3 is also carried out to meet the purpose. In Table 1 the results of few components are illustrated. From the table it is observed that the internal resistance observations are in relation with original components values. The statistical analysis shows an increase in values of resistances with reference to original component values. Ohm’s law circuit observations show less resistance values compared to original resistance values. A related graph is drawn and shown in Graph 1. Table 1 Resistors values - Using different electrical circuits Keywords : Accuracy, Error, Range and Standard Deviation Introduction The purpose of the study is to find the proportion of defective resistors within the arsenal of resistors that Holy Cross College uses for laboratories. The basic ingredients of the wide world of electronics are small components like resistors, condensers, diodes, transistors, IC chips etc. These are the fundamental block1 of any electronic gadget ranging from radio to pentium. No single component can perform any function unless it is in connection with other required components and has enough power supply. Graph 1 : Resistors values - using different electrical circuits Rationale Often we blame the students in their laboratory work regarding the results obtained by them. The curiosity arose in my mind why the students get different results when they perform the same experiment every day, every week and every year. The accuracy of the result used to be very different. In Tamilnadu during the year 2012-13, throughout the year there was about 16 hours of power cut. Power shut down or change of power due to the generator may be one of the causes for the inaccuracy obtained. Hence the investigation! Resistors These are the devices in various technological instruments to control current flow2 and therefore make the product efficient. It is probably the most Relative accuracy and error is determined using the mean value and is shown in Table 2. Table 2 Percent of deviation, Error and relative accuracy Graph 2 : Percent of deviation, Error and relative accuracy Graph 3 : Percent of deviation ,Error and relative accuracy A related graph is drawn and shown in Graph III. The percentage deviation values are small and give negative values. Because the calculated value in high resistance by leakage is very much small. The relative accuracy obtained using internal resistance method is linear and it is in good agreement with the standard result. Results A related graph is drawn and shown in Graph II. From the above graph it is understood that the relative accuracy is a fractional value and the error is a minimum fraction. Mean value shows a linear scale. A scientific experimental measurement is incomplete4,5 if one does not estimate the error of one’s result. Table 3 Percent of deviation, Error and relative accuracy Number of tables and graphs are drawn depending on the observations obtained during experimental work. Satisfactory results are obtained. Since it was impractical to study6,7 all resistors, a simple random sample instead was studied and predicted a range of population values based on the sample results. The study is limited with gold tolerance, therefore effectively eliminating a compounding factor. It is found that any resistor with a percentage deviation greater than the uniform sample tolerance level was categorized as defective. In the simple random sample that we calculated few of the tested resistors were defective. Only 5 were defective out of 30 in number. Discussions In this project various types of resistors are brought and are connected in various circuits like digital multimeter, ohm’s law circuit, internal resistance circuit and high resistance by leakage circuit. The readings have been taken and are tabulated. The resistance values are calculated using formula. The calculated resistance values are compared with the original components values and the level of achievements shown in Graph I, II & III. In the digital multimeter circuit, the calculated resistance values are mostly in good agreement with the component values. But it shows small positive correction. This may be due to the instrumental errors8 inherent in measuring because of their mechanical structure9. The leads of the digital multimeter may resist the circuit. Due to this there may be a chance of random errors. In the ohm’s law circuit, voltmeter and ammeter are used. Due to the loading effect in the voltmeter, small correction in this circuit is obtained. The correction is negative for higher values. The amount of heat developed into the circuit also one of the causes for getting different values in the observation. Environmental errors are due to the conditions external to the measuring device, including the area surrounding the instrument, such as the effects of temperature10, humidity and barometric pressure, magnetic or electrostatic fields. In the internal resistance circuit, the calculated values are exactly agreeing with the component values. But very small correction is obtained. This may be due to the gross errors. In the high resistance by leakage circuit, mostly the calculated value is not matching with the components value and also gives negative corrections. This may be due to the misuse of instrument and observational errors. Conclusion Some of the calculated resistance values are matched with the original components value and some of them are not. This may be due to the occurrence of various types of errors. The error may have occurred due to the problem with the apparatus. So great care should be taken while taking readings and handling the apparatus. Instrumental errors may be avoided by, (i) Selecting a suitable instrument for the particular measurement application (ii) Applying correction factor after determining the amount of instrumental error (iii) Calibrating the instrument against standard Personal or human errors are caused due to the limitations in the human senses. For an example, one may sometime consistently read the observed value either high or low and thus introduce systematic errors in the results. While at another time one may record the observed value slightly different than the actual reading and consequently introduce random error in the data. Therefore it is necessary to exercise extreme care with maturity and considered judgment regarding the observations so as to avoid such errors. Therefore it is understood from the above conclusion if exact resistance value is not obtained it is not the fault of the student. References 1. Sebastian, B. (2001). Electronic Projects for Engineers (pp. 40–42). Dreantech Press. Vardhan, H. (1993). Measurements : Principles and Practices (pp. 54–58). Macmillan India Limited. 3. Gruff, H. (1961). Technical Fundamentals Electronics (pp. 16–26). Asia Publishing House. 4. Kalsi, H. S. (1995). Electronic Instrumentation (pp. 1–18). Tata McGraw-Hill Publishing Company. 5. Johnson, K. (1979). Physics for you (pp. 30–32). Hutchinson Company. 6. Kaufmann, M., & Wilson, J. A. (1973). Basic Eletricity Theory and Practice (p. 104). Tata McGraw-Hill Publishing Company. 7. Nakra, B. C., & Chaudry, K. K. (1985). Instrumentation Measurement and Analysis (pp. 32–50). Tata McGraw-Hill Publishing Company. 8. Tayal, D. C. (1994). Electricity and Magnetism (pp. 233–234). Himalaya Publishing House. 9. Theraja, B. L. (2008). Basic Electronic Solid State (pp. 47–53). S. Chand and Company. 10. Shawney, A. K., & Shawney, P. (2003). A Course in Electrical and Electronic Measurements and Instrumentation (pp. 67–70). Dhanpat Rai and Company. 2.


