7 th Grade MathParent LetterChapter 8
advertisement
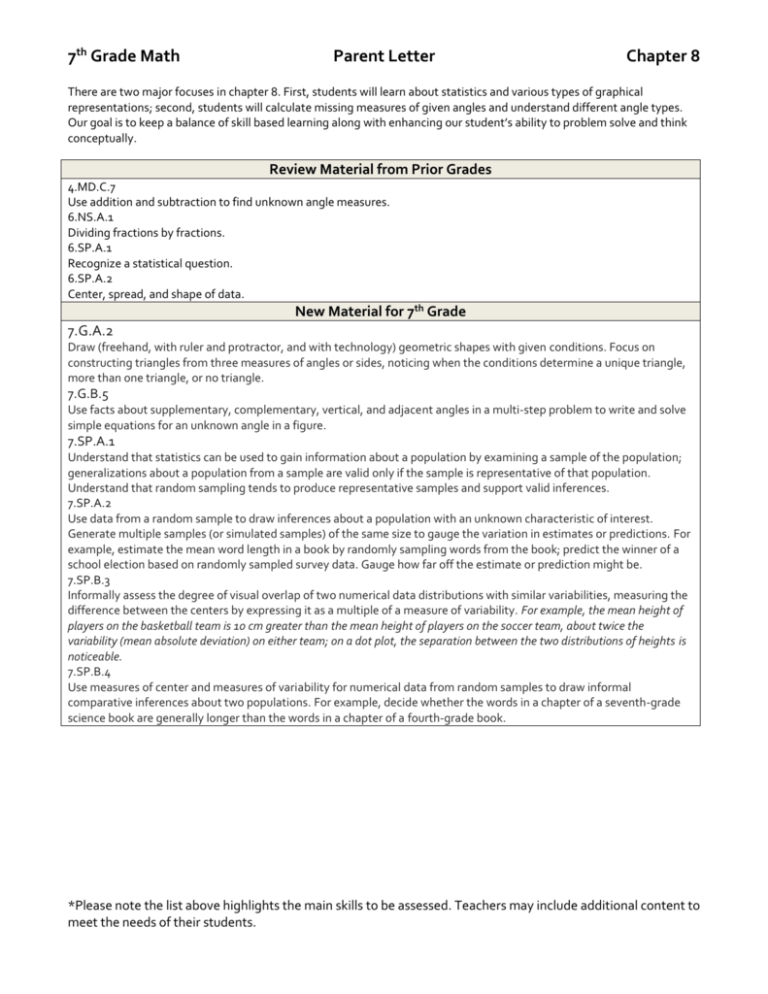
7th Grade Math Parent Letter Chapter 8 There are two major focuses in chapter 8. First, students will learn about statistics and various types of graphical representations; second, students will calculate missing measures of given angles and understand different angle types. Our goal is to keep a balance of skill based learning along with enhancing our student’s ability to problem solve and think conceptually. Review Material from Prior Grades 4.MD.C.7 Use addition and subtraction to find unknown angle measures. 6.NS.A.1 Dividing fractions by fractions. 6.SP.A.1 Recognize a statistical question. 6.SP.A.2 Center, spread, and shape of data. New Material for 7th Grade 7.G.A.2 Draw (freehand, with ruler and protractor, and with technology) geometric shapes with given conditions. Focus on constructing triangles from three measures of angles or sides, noticing when the conditions determine a unique triangle, more than one triangle, or no triangle. 7.G.B.5 Use facts about supplementary, complementary, vertical, and adjacent angles in a multi-step problem to write and solve simple equations for an unknown angle in a figure. 7.SP.A.1 Understand that statistics can be used to gain information about a population by examining a sample of the population; generalizations about a population from a sample are valid only if the sample is representative of that population. Understand that random sampling tends to produce representative samples and support valid inferences. 7.SP.A.2 Use data from a random sample to draw inferences about a population with an unknown characteristic of interest. Generate multiple samples (or simulated samples) of the same size to gauge the variation in estimates or predictions. For example, estimate the mean word length in a book by randomly sampling words from the book; predict the winner of a school election based on randomly sampled survey data. Gauge how far off the estimate or prediction might be. 7.SP.B.3 Informally assess the degree of visual overlap of two numerical data distributions with similar variabilities, measuring the difference between the centers by expressing it as a multiple of a measure of variability. For example, the mean height of players on the basketball team is 10 cm greater than the mean height of players on the soccer team, about twice the variability (mean absolute deviation) on either team; on a dot plot, the separation between the two distributions of heights is noticeable. 7.SP.B.4 Use measures of center and measures of variability for numerical data from random samples to draw informal comparative inferences about two populations. For example, decide whether the words in a chapter of a seventh-grade science book are generally longer than the words in a chapter of a fourth-grade book. *Please note the list above highlights the main skills to be assessed. Teachers may include additional content to meet the needs of their students. 7th Grade Math Parent Letter Chapter 8 End of Chapter Expectations 1) 2) 3) Skills assessment will cover all of the material from prior grades. Quiz on the new material as it relates to conceptual understanding. Performance-Based Assessment where students will work problems from previously taught chapters to ensure skills stay fresh on their mind. 4) Chapter assessment will cover the following skills: * Dividing rational numbers to include positive and negative values. Add, subtract, multiply, and divide rational numbers. Draw geometric shapes given specific criteria. Write and solve equations based on given angle measures and relationships. Understand appropriate sample size and the concept of random sampling. Draw inferences about a population and estimate/predict given data. Answer questions about graphs dealing with measures of center, (mean and median), and measures of variability, (interquartile range and absolute mean deviation). *Please note the list above highlights the main skills to be assessed. Teachers may include additional content to meet the needs of their students.
