Appendix 1. Thermal tolerance parameter estimation
advertisement
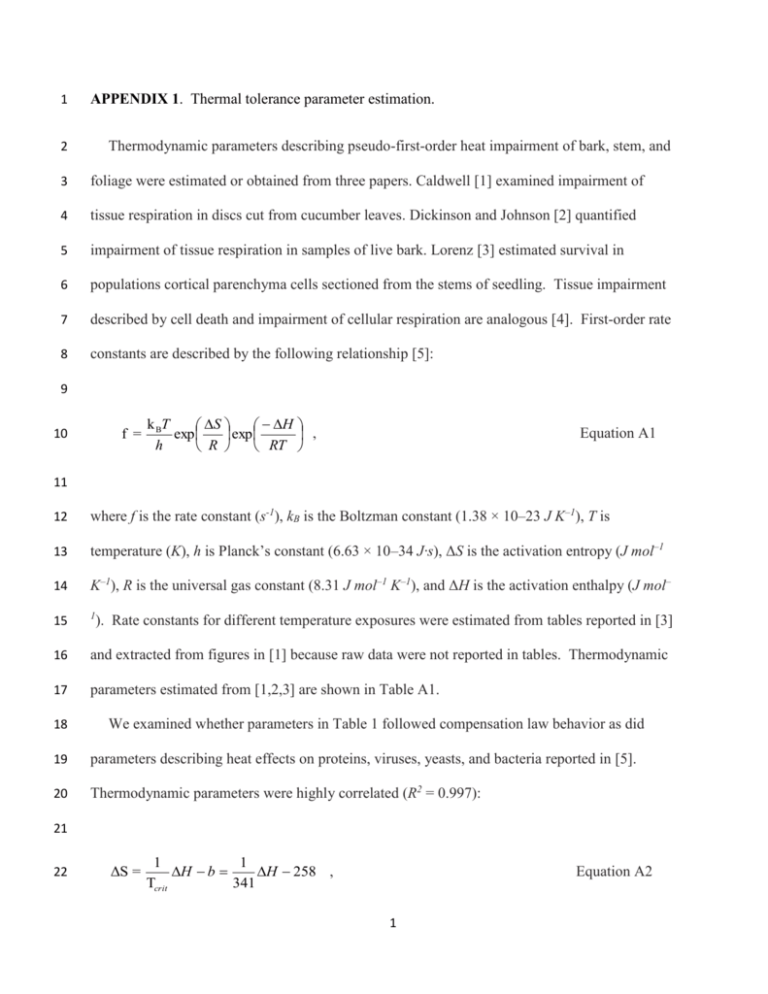
1 APPENDIX 1. Thermal tolerance parameter estimation. 2 Thermodynamic parameters describing pseudo-first-order heat impairment of bark, stem, and 3 foliage were estimated or obtained from three papers. Caldwell [1] examined impairment of 4 tissue respiration in discs cut from cucumber leaves. Dickinson and Johnson [2] quantified 5 impairment of tissue respiration in samples of live bark. Lorenz [3] estimated survival in 6 populations cortical parenchyma cells sectioned from the stems of seedling. Tissue impairment 7 described by cell death and impairment of cellular respiration are analogous [4]. First-order rate 8 constants are described by the following relationship [5]: 9 10 f = k BT S H exp exp , h R RT Equation A1 11 12 where f is the rate constant (s-1), kB is the Boltzman constant (1.38 × 10⁻²³ J K–1), T is 13 temperature (K), h is Planck’s constant (6.63 × 10⁻³⁴ J·s), ΔS is the activation entropy (J mol–1 14 K–1), R is the universal gas constant (8.31 J mol–1 K–1), and ΔH is the activation enthalpy (J mol– 15 1 16 and extracted from figures in [1] because raw data were not reported in tables. Thermodynamic 17 parameters estimated from [1,2,3] are shown in Table A1. 18 ). Rate constants for different temperature exposures were estimated from tables reported in [3] We examined whether parameters in Table 1 followed compensation law behavior as did 19 parameters describing heat effects on proteins, viruses, yeasts, and bacteria reported in [5]. 20 Thermodynamic parameters were highly correlated (R2 = 0.997): 21 22 ΔS = 1 1 H b H 258 , Tcrit 341 Equation A2 1 1 2 where Tc (K) is the compensation temperature and b is the intercept (J mol–1 K–1). These values 3 are similar to [5] values, where Tcrit ranged from 325-331 and b ranged from 268 to 272. The 4 parameter values in Equation A2 and the average of the activation enthalpy estimates in Table 5 A1 (ΔH = 318,344) were used in FireStem2D (see Equation 17). 6 2 Table A1. Thermodynamic parameters estimated by fitting Equation A1 to data. Data from the 25 °C pretreatment group were used from Caldwell (1993). Caldwell tested two varieties of cucumber (Poinsett and Ashley) and mean rate constants were extracted from his Figure 4 so standard deviation estimates were not valid. The temperature range (Tmin to Tmax) for each experiment is given (ºC). Study ΔS ΔH Species N Tmin Tmax Fall/Winter Populus tremuloides 17 43 65 372(140) 217524(46603) Fall/Winter Picea glauca 11 43 65 455(328) 246032(107117) Spring/Summer Populus tremuloides 10 43 65 665(133) 312522(43889) Spring/Summer Picea glauca 12 53 65 575(208) 283968(68354) Spring/Summer Pseudotsuga menziesii 15 43 65 528(252) 270036(81790) Spring/Summer Pinus contorta 17 43 65 518(214) 267984(70254) Catalpa speciosa 7 59 66 1649(533) 648885(178796) Pinus strobus 11 56 66 895(217) 396706(72666) Dickinson and Johnson (2004) Lorenz (1939) 3 Ulmus americana 12 57 68 844(244) 381648(81858) Picea glauca 14 56 69 529(176) 274719(59148) Pinus resinosa 9 58 66 872(198) 389085(66524) Poinsett 10 46 60 87(NA) 112131(NA) Cucumus sativa - Ashley 7 40 60 784(NA) 337230(NA) Caldwell (1993) Cucumus sativa - 4 LITERATURE CITED 1. Caldwell CR (1993) Estimation and analysis of cucumber (Cucumis sativus L.) leaf cellular heat sensitivity. Plant Physiology 101: 939–945. 2. Dickinson MB, Johnson EA (2004) Temperature-dependent rate models of vascular cambium cell mortality. Canadian Journal of Forest Research 34: 546-559. 3. Lorenz R (1939) High temperature tolerance of forest trees. St. Paul: University of Minnesota Agricultural Experiment Station. 4 Dickinson MB, Jolliff J, Bova AS (2004) Vascular cambium necrosis in forest fires: using hyperbolic temperature regimes to estimate parameters of a tissue-response model. Australian Journal of Botany 52: 757-763. 5. Rosenberg B, kemeny G, Switzer RC, Hamilton TC (1972) Quantitative evidence for protein denaturation as the cause of thermal death. Nature 232: 471-473. 5 6

