Millennials
advertisement
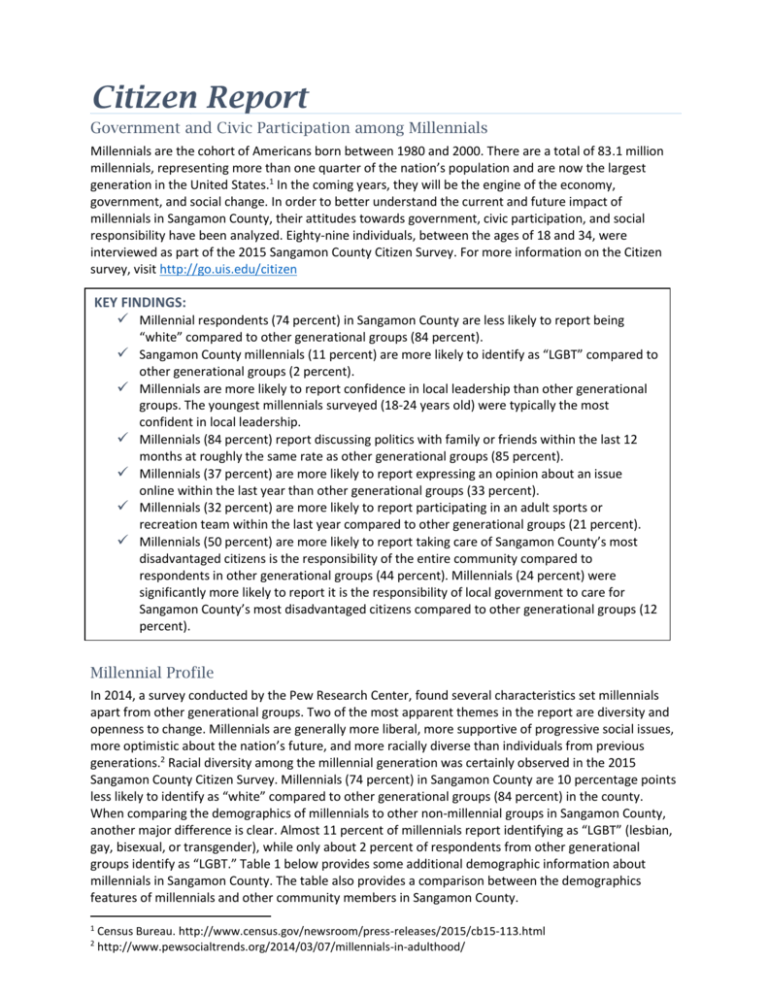
Citizen Report Government and Civic Participation among Millennials Millennials are the cohort of Americans born between 1980 and 2000. There are a total of 83.1 million millennials, representing more than one quarter of the nation’s population and are now the largest generation in the United States.1 In the coming years, they will be the engine of the economy, government, and social change. In order to better understand the current and future impact of millennials in Sangamon County, their attitudes towards government, civic participation, and social responsibility have been analyzed. Eighty-nine individuals, between the ages of 18 and 34, were interviewed as part of the 2015 Sangamon County Citizen Survey. For more information on the Citizen survey, visit http://go.uis.edu/citizen KEY FINDINGS: Millennial respondents (74 percent) in Sangamon County are less likely to report being “white” compared to other generational groups (84 percent). Sangamon County millennials (11 percent) are more likely to identify as “LGBT” compared to other generational groups (2 percent). Millennials are more likely to report confidence in local leadership than other generational groups. The youngest millennials surveyed (18-24 years old) were typically the most confident in local leadership. Millennials (84 percent) report discussing politics with family or friends within the last 12 months at roughly the same rate as other generational groups (85 percent). Millennials (37 percent) are more likely to report expressing an opinion about an issue online within the last year than other generational groups (33 percent). Millennials (32 percent) are more likely to report participating in an adult sports or recreation team within the last year compared to other generational groups (21 percent). Millennials (50 percent) are more likely to report taking care of Sangamon County’s most disadvantaged citizens is the responsibility of the entire community compared to respondents in other generational groups (44 percent). Millennials (24 percent) were significantly more likely to report it is the responsibility of local government to care for Sangamon County’s most disadvantaged citizens compared to other generational groups (12 percent). Millennial Profile In 2014, a survey conducted by the Pew Research Center, found several characteristics set millennials apart from other generational groups. Two of the most apparent themes in the report are diversity and openness to change. Millennials are generally more liberal, more supportive of progressive social issues, more optimistic about the nation’s future, and more racially diverse than individuals from previous generations.2 Racial diversity among the millennial generation was certainly observed in the 2015 Sangamon County Citizen Survey. Millennials (74 percent) in Sangamon County are 10 percentage points less likely to identify as “white” compared to other generational groups (84 percent) in the county. When comparing the demographics of millennials to other non-millennial groups in Sangamon County, another major difference is clear. Almost 11 percent of millennials report identifying as “LGBT” (lesbian, gay, bisexual, or transgender), while only about 2 percent of respondents from other generational groups identify as “LGBT.” Table 1 below provides some additional demographic information about millennials in Sangamon County. The table also provides a comparison between the demographics features of millennials and other community members in Sangamon County. 1 2 Census Bureau. http://www.census.gov/newsroom/press-releases/2015/cb15-113.html http://www.pewsocialtrends.org/2014/03/07/millennials-in-adulthood/ Table 1. Demographics of Millennials in Sangamon County Millennial (18-34) Other Generational Groups (age 35 or older) Race White African-American or Black Other/Mixed Race 74% 16% 7% 84% 10% 2% LGBT Identity 11% 2% Education Less than high school High school or GED Technical school or training Some college Four year college degree Higher degree (PhD, MA, etc.) 12% 30% 3% 29% 16% 9% 6% 27% 3% 28% 22% 14% Income Less than $15,000 $15,001-$30,000 $30,001-$45,000 $45,001-$60,000 $60,001-$75,000 $75,001-$100,000 $100,001 or more 12% 31% 10% 12% 11% 7% 7% 6% 10% 9% 11% 9% 15% 21% Unemployed and seeking work 7% 4% In addition to the findings above, it appears Sangamon County millennials are more likely to live in the urban spaces of the county. As illustrated by the map below, the highest concentration of millennial respondents lived in the urban core areas of Springfield. Less urban and rural areas of the county produced a smaller number of millennial respondents. Perceptions of Leadership and Government While the demographics of millennials may be changing, it seems their overall sentiment toward government and political leadership is more positive than that of previous generations. A 2010 study conducted by the Pew Research Center concludes millennials are less likely to be critical of the government than previous generations when asked about issues such as government effectiveness.3 While much has changed in the political sphere since 2010, the 2015 Sangamon Citizen’s Survey also found less critical attitudes toward government among Sangamon County millennials compared to other generations. Millennials (45 percent) are more likely to say they believe Sangamon County has “strong” leaders than respondents in other generational groups (39 percent). Additionally, millennials (63 percent) indicate confidence in the ability of local leaders to address local problems. When asked about their confidence in the ability of local elected leadership to address local problems, 63 percent of millennials indicate confidence, while only 54 percent of respondents in other generational groups indicate confidence. When analyzed at the aggregate level, Sangamon County millennial respondents are clearly more likely to report positive attitudes towards government than other generational groups. However, significant differences in sentiment are observed when comparing the attitudes of the youngest millennials surveyed (18-24 year old) to the attitudes of the oldest millennials (25-34 year old). Seventy-one percent of the youngest millennials (18-24) report confidence in local leaders, 74 percent report Sangamon County has “strong” leaders, and 82 percent report confidence in the local elected leaders of Sangamon County. Conversely, 57 percent of the oldest millennials (25-34) report confidence in local leaders, 38 percent indicated Sangamon County has “strong” leaders, and 57% reported confidence in the local elected leaders of Sangamon County. The graph below explores the perceptions of leadership and government among millennials and other generational groups in Sangamon County. Perceptions of Government and Leadership 90% 82% 80% 74% 71% 70% 63% 60% 50% 40% 57% 59% 63% 57% 54% 45% 35% 39% 30% 20% 10% 0% Percent who say Sangamon County Percent who are confident in local Percent who are confident in local has strong leaders leadersip elected leaders Millennial Response 3 Millennials 18-24 Millennials 25-34 Other Generational Groups http://www.pewsocialtrends.org/files/2010/10/millennials-confident-connected-open-to-change.pdf Civic Participation The majority of respondents in the 2015 Citizen Survey indicate volunteering or engaging in other forms of civic participation within the last 12 months. Millennials were no exceptions this rule. Millennials (84 percent) report discussing politics with friends or family at a very similar rate compared to other generational groups (85 percent). Millennials (37 percent) are more likely to have expressed an opinion about an issue online compared to other generational groups (33 percent). Additionally, millennials (32 percent) are significantly more likely to have participated in an adult sports or recreation team within the last twelve months compared to other generational groups (21 percent). While a number of millennials report donating money to a charitable or religious organization (61 percent) and volunteering through or for a charitable or religious organization (44 percent), these activities are reported at lower rates among millennials compared to other generational groups. The chart below compares the involvement of millennials to the involvement of non-millennials in five different categories. Five ways Sangamon County Millennials Get Involved 37% 33% Expressed your opinion about an issue online 85% 84% Discussed Politics with family or friends 77% Donated Money to a charitable organization 61% Wolunteered through or for a charitable or religious organization 51% 44% 21% Participate in adults sports or recreation team 32% 0% 10% 20% Other Generational Groups 30% 40% 50% 60% 70% 80% 90% Millennials Lower rates of charitable donations may be attributed to economic hardships faced by millennials such as a troubled economy or student debt. On average, Sangamon County millennials who obtained education after high school report borrowing over $32,000 to pay for post-secondary education. The youngest millennials (18-24) surveyed report borrowing upwards of $38,000 to fund their postsecondary education. On average, other generational groups only reported borrowing slightly over 20,000 to fund post-secondary education. Social Responsibility Perhaps due to their own experiences with worrisome economic conditions and mounting student debt, millennials seems to have a strong sense of social responsibility. When asked “thinking about Sangamon County’s most disadvantaged members of the community, who do you think is responsible for taking care of them?” Fifty percent of millennials report it is the responsibility of the entire community (ALL OF US) to take care of them, while another 24 percent indicate it is local government’s responsibility. Only 14 percent of millennial respondents report it is the sole responsibility of the individuals themselves. Interestingly, only a very small percentage of millennial (4 percent) and non-millennial (6 percent) respondents report it is the responsibility of charity or church groups to care for Sangamon County’s most disadvantaged community members. Community members in other generational groups were less likely to indicate it is the responsibility of the entire community or local government to care for Sangamon County’s most disadvantaged citizens. However, they were slightly more likely to indicate it is the responsibility of a charitable or religious organization and significantly more likely to indicate it is the responsibility of the individuals to care for themselves. The chart below provides a comparison of millennial and non-millennial attitudes towards Sangamon County’s most disadvantaged community members. Who is responsible for taking care of Sangamon County's most disadvantaged citizens? 6% 4% Charity or Church group 12% Local Government 24% 44% Entire community (ALL OF US) 50% 30% Individuals themselves 14% 0% 10% 20% Other Generational Groups 30% Millennials 40% 50% 60%
