Circle Graphs * Calculating Central Angles
advertisement
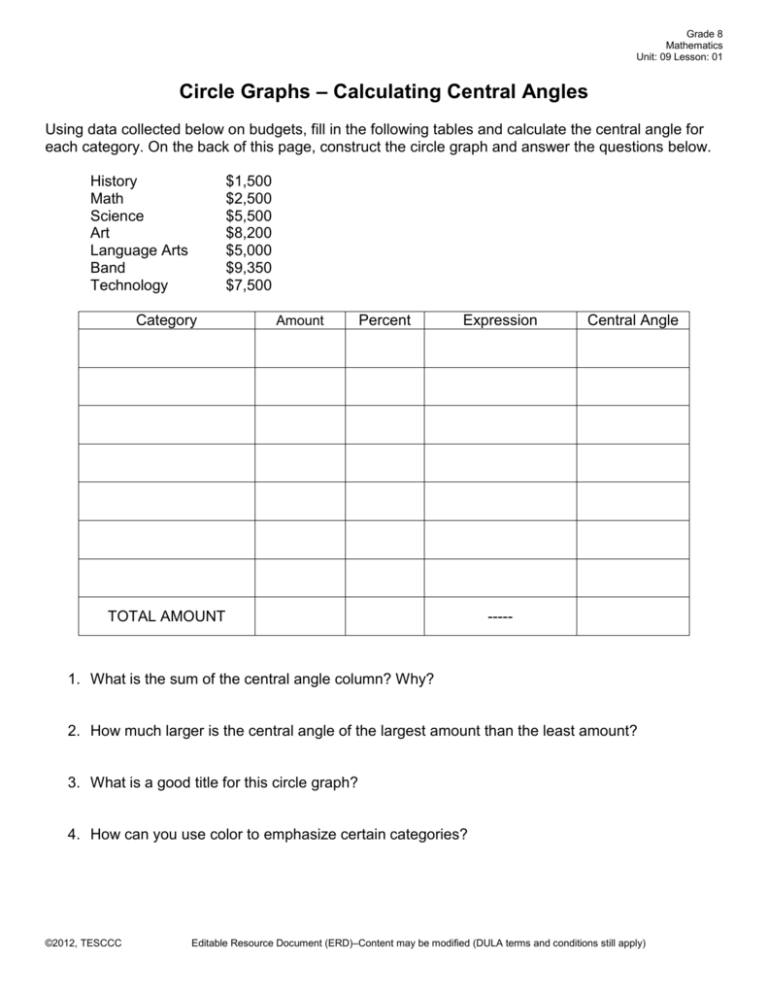
Grade 8 Mathematics Unit: 09 Lesson: 01 Circle Graphs – Calculating Central Angles Using data collected below on budgets, fill in the following tables and calculate the central angle for each category. On the back of this page, construct the circle graph and answer the questions below. History Math Science Art Language Arts Band Technology $1,500 $2,500 $5,500 $8,200 $5,000 $9,350 $7,500 Category Amount Percent Expression TOTAL AMOUNT Central Angle ----- 1. What is the sum of the central angle column? Why? 2. How much larger is the central angle of the largest amount than the least amount? 3. What is a good title for this circle graph? 4. How can you use color to emphasize certain categories? ©2012, TESCCC Editable Resource Document (ERD)–Content may be modified (DULA terms and conditions still apply)
