Math 8
advertisement
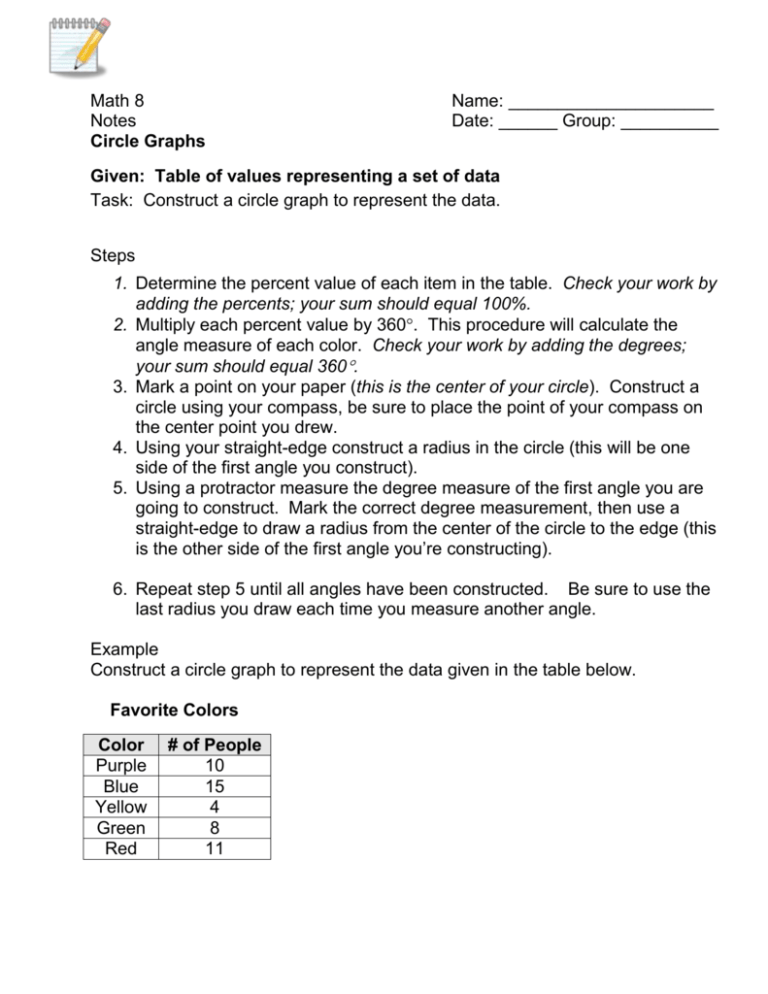
Math 8 Notes Circle Graphs Name: _____________________ Date: ______ Group: __________ Given: Table of values representing a set of data Task: Construct a circle graph to represent the data. Steps 1. Determine the percent value of each item in the table. Check your work by adding the percents; your sum should equal 100%. 2. Multiply each percent value by 360. This procedure will calculate the angle measure of each color. Check your work by adding the degrees; your sum should equal 360. 3. Mark a point on your paper (this is the center of your circle). Construct a circle using your compass, be sure to place the point of your compass on the center point you drew. 4. Using your straight-edge construct a radius in the circle (this will be one side of the first angle you construct). 5. Using a protractor measure the degree measure of the first angle you are going to construct. Mark the correct degree measurement, then use a straight-edge to draw a radius from the center of the circle to the edge (this is the other side of the first angle you’re constructing). 6. Repeat step 5 until all angles have been constructed. Be sure to use the last radius you draw each time you measure another angle. Example Construct a circle graph to represent the data given in the table below. Favorite Colors Color Purple Blue Yellow Green Red # of People 10 15 4 8 11

