Safe-Health-Neighborhoods-action-plan-feb-2015
advertisement
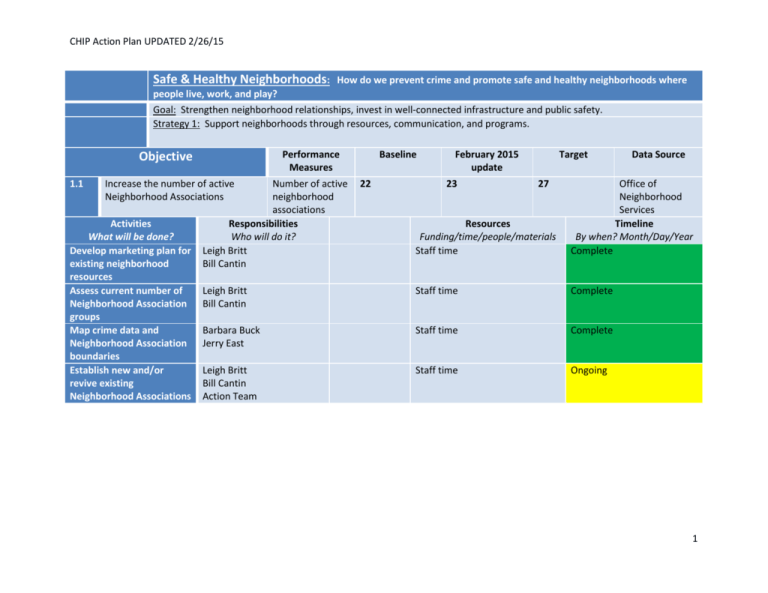
CHIP Action Plan UPDATED 2/26/15 Safe & Healthy Neighborhoods: How do we prevent crime and promote safe and healthy neighborhoods where people live, work, and play? Goal: Strengthen neighborhood relationships, invest in well-connected infrastructure and public safety. Strategy 1: Support neighborhoods through resources, communication, and programs. Performance Measures Objective 1.1 Increase the number of active Neighborhood Associations Activities What will be done? Develop marketing plan for existing neighborhood resources Assess current number of Neighborhood Association groups Map crime data and Neighborhood Association boundaries Establish new and/or revive existing Neighborhood Associations Number of active neighborhood associations Responsibilities Who will do it? Leigh Britt Bill Cantin Baseline 22 February 2015 update 23 Target 27 Data Source Resources Funding/time/people/materials Staff time Office of Neighborhood Services Timeline By when? Month/Day/Year Complete Leigh Britt Bill Cantin Staff time Complete Barbara Buck Jerry East Staff time Complete Leigh Britt Bill Cantin Action Team Staff time Ongoing 1 CHIP Action Plan UPDATED 2/26/15 Safe & Healthy Neighborhoods: How do we prevent crime and promote safe and healthy neighborhoods where people live, work, and play? Goal: Strengthen neighborhood relationships, invest in well-connected infrastructure and public safety. Strategy 1: Support neighborhoods through resources, communication, and programs. Performance Measures Objective 1.2 Increase the number of trained Neighborhood Watch members Activities What will be done? Map crime data and Neighborhood Watch groups Assess current number of Neighborhood Watch members Establish new and/or revive existing Neighborhood Watch groups by providing training Pursue funding for public safety programs Number of Neighborhood Watch members Baseline 87 February 2015 update 128 Target 150 Data Source Neighborhood Watch program Responsibilities Who will do it? Barbara Buck Jerry East Resources Funding/time/people/materials Staff time Office of Neighborhood Services Timeline By when? Month/Day/Year Complete Melvin Buckner Bill Cantin Staff time Ongoing Melvin Buckner Bill Cantin Staff time Ongoing Melvin Buckner Barbara Buck Action Team Staff time Ongoing 2 CHIP Action Plan UPDATED 2/26/15 Safe & Healthy Neighborhoods: How do we prevent crime and promote safe and healthy neighborhoods where people live, work, and play? Goal: Strengthen neighborhood relationships, invest in well-connected infrastructure and public safety. Strategy 1: Support neighborhoods through resources, communication, and programs. Objective 1.3 Increase utilization of, and dedicate full-time staff persons to, neighborhood-based programs Performance Measures Funding for neighborhoodbased programs Baseline $6,000 for neighborhood activities; $2,500 for neighborhood mini-grants; $3,000 for neighborhood cleanups; $1,000 for tools and signs for neighborhoods; $500 for neighborhood training on code compliance $13,000 total February 2015 update ONS staff collecting data Target $13,000 Data Source Office of Neighborhood Services Funds expended as of May 13, 2014 $272.99 minigrants $938.05 cleanups $96.90 printing $1,307.94 total 3 CHIP Action Plan UPDATED 2/26/15 Number of neighborhoods utilizing resources Dedicated fulltime staff person(s) Activities What will be done? Establish baseline funding for neighborhood-based programs Determine feasibility for dedicated full-time staff person(s) 10 ONS staff collecting data 0 FTE (request for additional staff was not recommended for FY2015) 0 (no staff added for FY2015) 15 Office of Neighborhood Services .5 FTE Office of Neighborhood Services Responsibilities Who will do it? Bill Cantin Resources Funding/time/people/materials Staff time Neighborhood Watch program Timeline By when? Month/Day/Year Complete Leigh Britt Bill Cantin Melvin Buckner Staff time Ongoing 4 CHIP Action Plan UPDATED 2/26/15 Safe & Healthy Neighborhoods: How do we reduce crime and promote safe and healthy neighborhoods where people live, work, and play? Goal: Strengthen neighborhood relationships, invest in well-connected infrastructure and public safety. Strategy 2: Advocate for the increased funding for well-connected infrastructure. Objective Performance Measures Baseline 2.1 Increase funding for well-connected infrastructure Funding for wellconnected infrastructure FY2014 CIP general fund budget requests $15,491,726 for 10 street projects $2,398,593 for 9 sidewalk projects Major maintenance $751,000 for 3 projects $1,092,000 for 12 parks projects $100,000 for Greenbelt/trail FY2015 CIP is approx. $13.8 million for 1-2 year projects 0 Community Development has sent aside funding for HIA Infrastructure defined as sidewalks, trails, street lights, parks, and public transit Increase the use of Health Impact Assessments (HIA) in infrastructure planning and development Increase neighborhood walk-throughs with policy makers Number of completed HIAs Number of neighborhood walk-throughs with 0 February 2015 update 3-5 year projects $24 million + (Amount varies due to infrastructure needs, priorities, and funding) 0 (potentially review this measure) Target Maintain current funding level Data Source FY2014 budget/CIP Numerous projects but not enough funding. Last $6 million of GetAbout money is being spent over the next 2 fiscal years. Will need to reevaluate once GetAbout grant is complete. 1 Public Health & Human Services 12 Community Development Office of Sustainability 5 CHIP Action Plan UPDATED 2/26/15 policymakers Increase the number of community champions who advocate for infrastructure funding Number of funding advocates Activities What will be done? Establish baseline funding for well-connected infrastructure Responsibilities Who will do it? Jason Wilcox Barbara Buffaloe Rachel Bacon Coordinate neighborhood walk-throughs with policy makers Barbara Buffaloe Bill Cantin Lawrence Simonson Include recommendations from an HIA on proposed pedestrian infrastructure Identify community champions to advocate for increased infrastructure funding Jason Wilcox Rachel Bacon Lawrence Simonson Neighborhood leaders 130 PedNet staff individuals/households collecting data (representing 286 people) 4 clubs/organizations (representing 1,185 people) 13 businesses (representing 2,344 people) 147 total memberships Resources Funding/time/people/materials Staff time Staff time City Ward Check-ins Collaboration with Healthy Lifestyles Action Team Staff time Consolidated Planning Funding (CPG) PedNet Community advocates 162 PedNet Timeline By when? Month/Day/Year Complete Ongoing Ongoing Ongoing 6 CHIP Action Plan UPDATED 2/26/15 Safe & Healthy Neighborhoods: How do we reduce crime and promote safe and healthy neighborhoods where people live, work, and play? Goal: Strengthen neighborhood relationships, invest in well-connected infrastructure and public safety. Strategy 3: Reduce crime by implementing progressive crime prevention and intervention strategies. Performance Measures Objective 3.1 Increase the frequency of positive interaction between public safety agencies and the community Activities What will be done? Increase the number of public relation events with neighborhoods and public safety officers Number of outreach events Responsibilities Who will do it? Barbara Buck Melvin Buckner Baseline February 2015 update 2013 – 78 2014 – 73 yr to date (Doesn’t include Neighborhood Watch numbers) CPD staff collecting data for rest of 2014 and 2015 YTD Target 5% increase to 2014 numbers Resources Funding/time/people/materials Staff time Google calendar Data Source Columbia Police Department Google site for media/patrol Timeline By when? Month/Day/Year Ongoing 7 CHIP Action Plan UPDATED 2/26/15 Safe & Healthy Neighborhoods: How do we reduce crime and promote safe and healthy neighborhoods where people live, work, and play? Goal: Strengthen neighborhood relationships, invest in well-connected infrastructure and public safety. Strategy 3: Reduce crime by implementing progressive crime prevention and intervention strategies. Objective Performance Measures Baseline February 2015 update 3.2 Increase after-school programming for at-risk youth population Number of youth using afterschool programs 52 students enrolled in TOP program 2013-14 school year (gathering data from other sources) Michelle getting numbers. TOP has been expanded to the county so #’s should increase Activities What will be done? Collect baseline data on the number of youth using after-school programming Responsibilities Who will do it? Michelle Riefe Becky Markt Expand current programming Michelle Riefe Becky Markt Collect follow-up data Michelle Riefe Becky Markt Target 5% increase Resources Funding/time/people/materials Staff time Teen Outreach Program (TOP) Youth Community Coalition (YC²) Boys & Girls Club Staff time Teen Outreach Program (TOP) Youth Community Coalition (YC²) Boys & Girls Club Staff time Teen Outreach Program (TOP) Youth Community Coalition (YC²) Boys & Girls Club Data Source PHHS YC2 Timeline By when? Month/Day/Year Ongoing (have TOP numbers) Ongoing Ongoing 8
