CHAPTER 11 REVIEW 1. The perception of danger is an important
advertisement
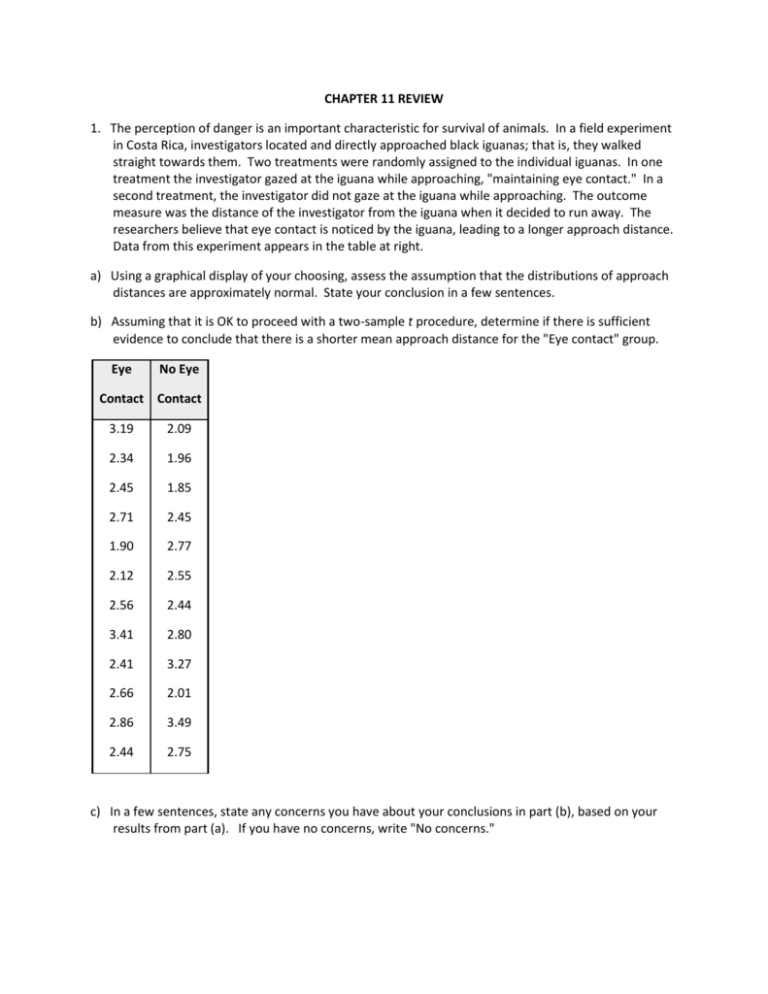
CHAPTER 11 REVIEW 1. The perception of danger is an important characteristic for survival of animals. In a field experiment in Costa Rica, investigators located and directly approached black iguanas; that is, they walked straight towards them. Two treatments were randomly assigned to the individual iguanas. In one treatment the investigator gazed at the iguana while approaching, "maintaining eye contact." In a second treatment, the investigator did not gaze at the iguana while approaching. The outcome measure was the distance of the investigator from the iguana when it decided to run away. The researchers believe that eye contact is noticed by the iguana, leading to a longer approach distance. Data from this experiment appears in the table at right. a) Using a graphical display of your choosing, assess the assumption that the distributions of approach distances are approximately normal. State your conclusion in a few sentences. b) Assuming that it is OK to proceed with a two-sample t procedure, determine if there is sufficient evidence to conclude that there is a shorter mean approach distance for the "Eye contact" group. Eye No Eye Contact Contact 3.19 2.09 2.34 1.96 2.45 1.85 2.71 2.45 1.90 2.77 2.12 2.55 2.56 2.44 3.41 2.80 2.41 3.27 2.66 2.01 2.86 3.49 2.44 2.75 c) In a few sentences, state any concerns you have about your conclusions in part (b), based on your results from part (a). If you have no concerns, write "No concerns." 3. In many animal societies, a role assumed by the adult male is a sentry, warning adult females and juveniles of approaching predators. Some students of animal behavior believe that in human society this role is active also. An interesting variation of this theory is that the human female accepts this role. In one 4-month study in Seattle, an investigator observed people crossing the street at an intersection with no traffic control. The observed behavior was the scanning behavior ("looking both ways") of adult males and females. The investigator reasoned that if the adult female accepted the protection of the adult male, the scanning rate when alone would be greater than when accompanied by an adult female. Data from this study is given below. Do these data support the investigator's hypothesis that the female scanning rate would be less when accompanied by a male? Assume that it is reasonable to regard these samples as representative of the corresponding populations. Provide statistical justification for your answer. Female Scanning ("Looking both ways") Behavior Situation Scanned Did Not Totals Scan Alone 60 20 80 With adult male 37 39 76 5. Body fat and lean body mass can be estimated in living animals by measuring the total body electrical conductivity (TOBEC). This technique is useful when attempting to determine if "diet drugs" are working on laboratory rats over time – the researchers need not sacrifice the animals to measure the amount of adipose body fat after periods of drug usage. However, the procedure requires that the animal be totally inside the measurement chamber, which is fairly small. Some rats are so big their tails must be tucked under their bodies before putting them into the measurement chamber. This is causing concern among the researchers, because there is a possibility the tail position might alter the measurements. To see if the TOBEC measurement is altered by the tail position of the rats, an experiment was run on 16 rats ranging in weight from 210 to 505 g. The rats were randomly assigned the order of measurement, with 8 rats measured in the tail-under position first, and 8 rats in the tail-extended position. The data for the lean mass measures are presented in the table below. TOBEC Measures of Lean Mass (g) Tail Under and Tail Extended Tail Tail Tail Tail Under Extended Under Extended 193.5 203.9 276.4 286.5 200.3 215.8 275.6 291.8 211.4 228.5 300.7 303.5 231.1 241.0 300.0 306.7 249.1 259.4 303.6 303.7 266.4 270.2 305.6 316.8 274.8 282.6 302.4 296.1 277.5 276.9 354.2 356.1 a) Test the hypothesis that there is no difference between the population mean TOBEC measurements of rats in the tailunder vs. the tail-extended positions. For purposes of the statistics you may assume that these rats are a random sample of laboratory rats. b) Write a short paragraph based on your analysis above, explaining your results for laboratory technicians. Your paragraph should advise them whether or not it is necessary to make sure the tail positions of the rats are the same when replicating the lean mass body measurements during the experiment. 6. The home range of an animal is the average area an animal occupies while foraging for food and defending its territory. It is thought that home ranges of animals usually do not change much, except when an area is under ecological stress. As part of a study of white-tailed deer in Florida in 1991 and 1992, deer were radiocollared and their movements followed over the course of a year. The home range data for a random sample of 18 white-tailed deer are shown below in Table 1. The raw area of the home range for each of the deer is reported in hectares for the years 1991 and 1992. (A hectare is a metric unit of area equal to 2.471 acres.) The investigators are interested in determining whether the home range white-tailed deer change over the course of as little time as a year. Table 1: Home Ranges of 18 white-tailed deer. 1992 HR 1991 HR Diff HR 1992 HR 1991 HR Diff HR 80 175 95 95 104 9 268 206 -62 152 319 167 113 103 -10 133 59 -74 83 93 10 293 125 -168 24 9 -15 32 112 80 111 115 4 80 206 126 100 135 35 61 115 54 103 14 -89 271 49 -222 293 104 -189 111 150 39 a) Construct a 95% confidence interval for the difference in means of the home ranges from 1991 to 1992. b) Do the data provide evidence of a change in the size of the home ranges between 1991 and 1992? Provide statistical justification for your response.
