Fulltext
advertisement
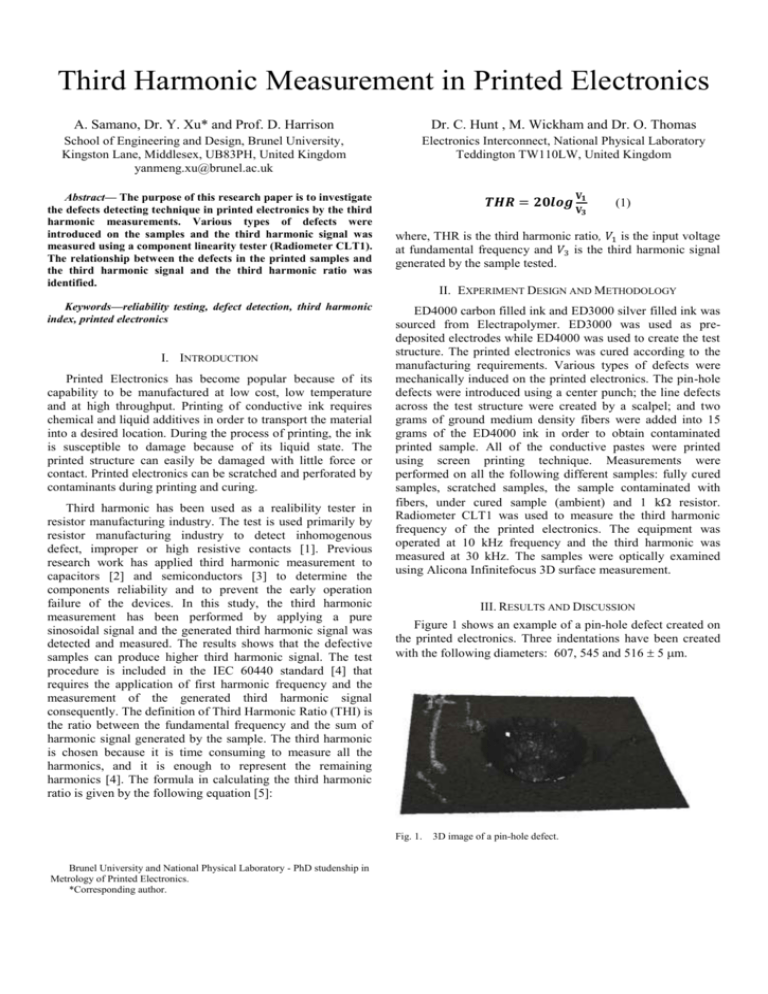
Third Harmonic Measurement in Printed Electronics A. Samano, Dr. Y. Xu* and Prof. D. Harrison Dr. C. Hunt , M. Wickham and Dr. O. Thomas School of Engineering and Design, Brunel University, Kingston Lane, Middlesex, UB83PH, United Kingdom yanmeng.xu@brunel.ac.uk Electronics Interconnect, National Physical Laboratory Teddington TW110LW, United Kingdom Abstract— The purpose of this research paper is to investigate the defects detecting technique in printed electronics by the third harmonic measurements. Various types of defects were introduced on the samples and the third harmonic signal was measured using a component linearity tester (Radiometer CLT1). The relationship between the defects in the printed samples and the third harmonic signal and the third harmonic ratio was identified. Keywords—reliability testing, defect detection, third harmonic index, printed electronics I. INTRODUCTION Printed Electronics has become popular because of its capability to be manufactured at low cost, low temperature and at high throughput. Printing of conductive ink requires chemical and liquid additives in order to transport the material into a desired location. During the process of printing, the ink is susceptible to damage because of its liquid state. The printed structure can easily be damaged with little force or contact. Printed electronics can be scratched and perforated by contaminants during printing and curing. Third harmonic has been used as a realibility tester in resistor manufacturing industry. The test is used primarily by resistor manufacturing industry to detect inhomogenous defect, improper or high resistive contacts [1]. Previous research work has applied third harmonic measurement to capacitors [2] and semiconductors [3] to determine the components reliability and to prevent the early operation failure of the devices. In this study, the third harmonic measurement has been performed by applying a pure sinosoidal signal and the generated third harmonic signal was detected and measured. The results shows that the defective samples can produce higher third harmonic signal. The test procedure is included in the IEC 60440 standard [4] that requires the application of first harmonic frequency and the measurement of the generated third harmonic signal consequently. The definition of Third Harmonic Ratio (THI) is the ratio between the fundamental frequency and the sum of harmonic signal generated by the sample. The third harmonic is chosen because it is time consuming to measure all the harmonics, and it is enough to represent the remaining harmonics [4]. The formula in calculating the third harmonic ratio is given by the following equation [5]: 𝐕 𝑻𝑯𝑹 = 𝟐𝟎𝒍𝒐𝒈 𝐕𝟏 𝟑 where, THR is the third harmonic ratio, 𝑉1 is the input voltage at fundamental frequency and 𝑉3 is the third harmonic signal generated by the sample tested. II. EXPERIMENT DESIGN AND METHODOLOGY ED4000 carbon filled ink and ED3000 silver filled ink was sourced from Electrapolymer. ED3000 was used as predeposited electrodes while ED4000 was used to create the test structure. The printed electronics was cured according to the manufacturing requirements. Various types of defects were mechanically induced on the printed electronics. The pin-hole defects were introduced using a center punch; the line defects across the test structure were created by a scalpel; and two grams of ground medium density fibers were added into 15 grams of the ED4000 ink in order to obtain contaminated printed sample. All of the conductive pastes were printed using screen printing technique. Measurements were performed on all the following different samples: fully cured samples, scratched samples, the sample contaminated with fibers, under cured sample (ambient) and 1 k resistor. Radiometer CLT1 was used to measure the third harmonic frequency of the printed electronics. The equipment was operated at 10 kHz frequency and the third harmonic was measured at 30 kHz. The samples were optically examined using Alicona Infinitefocus 3D surface measurement. III. RESULTS AND DISCUSSION Figure 1 shows an example of a pin-hole defect created on the printed electronics. Three indentations have been created with the following diameters: 607, 545 and 516 5 m. Fig. 1. Brunel University and National Physical Laboratory - PhD studenship in Metrology of Printed Electronics. *Corresponding author. (1) 3D image of a pin-hole defect. Figure 2 to 4 show three different sizes of single line scratch defects cut over the tested structure with various width. Figure 2 is the defect of 0.40 0.01 mm over 2.37 0.01 mm width of the tested structure which is equivalent to 17 % of the structure. Figure 3 is the defect of 0.97 0.01 mm over 2.26 0.01 mm width of the tested structure which is equivalent to 42% of the structure. Figure 4 is the defect of 1.45 0.01 mm over 2.04 0.01 mm width of the tested structure which is equivalent to 71% of the structure. Figure 5 shows total of 9 line scratches made alternatively on the two sides of the tested structure. Several scratches were cut across the test structure, however, the remaining conductive path was maintained for at least 50% of the structure. Fig. 5. Fig. 2. 17% defect across the tested structure. Fig. 3. 42% defect across the tested structure. Fig. 4. 71% defect across the tested structure. 9 alternating line defects across the tested structure. Figure 6 is the measurement results of the third harmonic on the printed structure for all the samples with different defective conditions. It shows that at higher input voltage the alternating defects with 9 alternating line cuts across the tested structure generated distinguished higher third harmonic signal compared with all the other samples with various condition of defects or non-defects, and the higher the input voltage the larger the difference of the third harmonic measurement. It can be seen that all the samples with different defective conditions produced an increasing third harmonic signal in line with the increase of input voltage. A summary of the THR measurements is shown in Table I. It can be found out that the initial value of 114 dB for the fully cured printed electronics decreased when more defects were introduced. The pin-holes have the least effect on the THR value, followed by the increasing percentage of defects across the tested structure. The alternating defects with the total nine cuts across the tested structure have produced the largest third harmonic signal thus the smallest THR. Therefore, a number of cuts across the tested structure will generate more harmonic signal than a single cut defect. The individual pin-hole defect also generated third harmonic signal enough to differentiate it from the fully cured printed electronics. The third harmonic measurement comparison between fully cure printed electronics and commercially available 1 k resistor which is produced through high vacuum deposition, showed that the printed electronics produces higher third harmonic signal as compared to high vacuum deposition process. The printed electronics samples containing fibers or under cured (ambient) produced higher THR and lower third harmonic signal than the fully cured samples. This was due to the response of the contaminants to the AC test frequency applied. Therefore, the Third harmonic Measurement is not suitable to detect this type of defects. REFERENCES [1] [2] [3] [4] [5] Fig. 6. Third harmonic measurements. TABLE I. THR MEASUREMENTS Printed Electronics THR (dB) THR difference to fully cured (dB) Fully cured 114.0 Pin holes 113.2 0.8 17 % Defect 112.2 1.8 42 %Defect 112.6 1.2 71 %Defect 110.5 3.5 Alternating 92.6 21.3 Fibers 114.6 -0.6 Ambient 116.3 -2.3 1 k 121.2 -7.3 IV. CONCLUSION The third harmonic measurement is capable of detecting defects in the printed electronics such as scratches or pin-hole defects. However, it cannot detect contamination such as fibers and under cured printed electronics due the response of the contaminants to the AC test frequency. The fully cured printed electronics will generate higher third harmonic signal compared to the commercially available 1 k resistor. A. Salomon and T. Troianello, "Component Linearity Test Improves Reliability Screening Through Measurement of Third Harmonic Index." pp. 69-76, 1973. L. Spiralski, L. Hasse, K. Rogala and J. Turczyński, "Production testing of high reliability interference suppressor capacitors", XVII IMEKO World Congress, pp. 1486-1488, 2003. E. P. Vandamme and L. K. J. Vandamme, "Current crowding and its effect on 1/f noise and third harmonic distortion - A case study for quality assessment of resistors," Microelectronics Reliability, vol. 40, pp. 1847-1853, 1999. R. W. Kuehl, "Reliability of thin-film resistors: Impact of third harmonic screenings," Microelectronics Reliability, vol. 42, pp. 807813, 2002. The British Standards Institution, "BS EN 60440:2012," London, U.K.: BSI Standards Limited, 2012, pp. 9-10.

