Appendixes
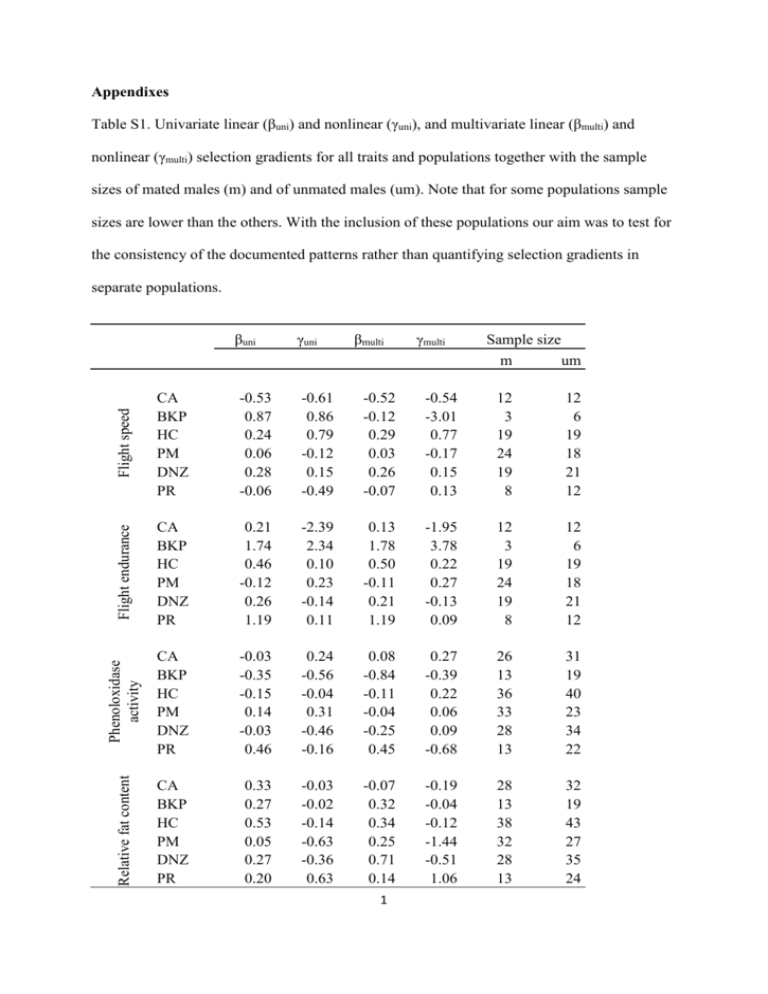
Table S1. Univariate linear (βuni) and nonlinear (γuni), and multivariate linear (βmulti) and
nonlinear (γmulti) selection gradients for all traits and populations together with the sample
sizes of mated males (m) and of unmated males (um). Note that for some populations sample
sizes are lower than the others. With the inclusion of these populations our aim was to test for
the consistency of the documented patterns rather than quantifying selection gradients in
separate populations.
Sample size
m
um
Flight speed
γmulti
CA
BKP
HC
PM
DNZ
PR
-0.53
0.87
0.24
0.06
0.28
-0.06
-0.61
0.86
0.79
-0.12
0.15
-0.49
-0.52
-0.12
0.29
0.03
0.26
-0.07
-0.54
-3.01
0.77
-0.17
0.15
0.13
12
3
19
24
19
8
12
6
19
18
21
12
Flight endurance
βmulti
CA
BKP
HC
PM
DNZ
PR
0.21
1.74
0.46
-0.12
0.26
1.19
-2.39
2.34
0.10
0.23
-0.14
0.11
0.13
1.78
0.50
-0.11
0.21
1.19
-1.95
3.78
0.22
0.27
-0.13
0.09
12
3
19
24
19
8
12
6
19
18
21
12
Phenoloxidase
activity
γuni
CA
BKP
HC
PM
DNZ
PR
-0.03
-0.35
-0.15
0.14
-0.03
0.46
0.24
-0.56
-0.04
0.31
-0.46
-0.16
0.08
-0.84
-0.11
-0.04
-0.25
0.45
0.27
-0.39
0.22
0.06
0.09
-0.68
26
13
36
33
28
13
31
19
40
23
34
22
Relative fat content
βuni
CA
BKP
HC
PM
DNZ
PR
0.33
0.27
0.53
0.05
0.27
0.20
-0.03
-0.02
-0.14
-0.63
-0.36
0.63
-0.07
0.32
0.34
0.25
0.71
0.14
-0.19
-0.04
-0.12
-1.44
-0.51
1.06
28
13
38
32
28
13
32
19
43
27
35
24
1
βuni
γuni
βmulti
γmulti
Sample size
m
um
Flight muscle ratio
CA
BKP
HC
PM
DNZ
PR
-0.23
-0.31
0.08
0.30
0.26
-0.31
0.53
-1.31
0.56
0.06
-0.55
-0.19
-0.24
-0.16
0.33
0.60
0.43
-0.06
0.81
-1.23
0.61
0.10
-0.33
-0.65
29
13
38
33
28
13
33
19
42
27
34
24
Wing length
CA
BKP
HC
PM
DNZ
PR
-0.54
-0.48
-0.42
-0.63
0.30
0.67
-0.21
0.27
0.12
0.04
0.38
0.33
-0.54
-0.19
-0.42
-0.70
0.17
0.81
-0.54
-0.47
0.25
0.05
0.25
-1.01
29
13
36
31
28
13
33
19
43
27
32
24
Aspect ratio
CA
BKP
HC
PM
DNZ
PR
0.11
-0.78
-0.08
0.14
0.01
-0.02
-1.08
0.28
0.16
0.04
-0.17
0.48
0.51
-0.80
0.15
0.48
-0.17
-0.26
-1.36
-0.90
0.14
-0.47
-0.13
0.54
28
13
36
29
27
12
33
18
41
26
31
24
Wing loading
Continuation of Table S1.
CA
BKP
HC
PM
DNZ
PR
0.25
0.09
0.39
-0.51
0.00
0.06
0.68
1.20
-0.14
0.03
0.45
0.60
0.15
0.37
0.25
-0.55
-0.18
-0.04
0.26
0.86
-0.38
-0.02
0.25
0.45
26
13
35
29
27
12
32
18
41
26
31
23
2
Table S2. Multivariate results of the generalized linear model analyses examining sexual
selection on the two flight performance traits in the set of six study populations of the
damselfly C. puella. Significant p-values are indicated in bold.
Population (Pop)
Flight speed (PC1)
Flight speed (PC1)2
Flight speed (PC1) × Pop
Flight speed (PC1)2 × Pop
Flight endurance (PC2)
Flight endurance (PC2)2
Flight endurance (PC2)× Pop
Flight endurance (PC2)2 × Pop
df
5
1
1
5
5
1
1
5
5
Mating success
χ2
p
3.9641
0.55
0.6614
0.42
0.2878
0.59
3.9546
0.56
6.6027
0.25
5.8360
0.016
0.1924
0.66
6.3597
0.27
1.6723
0.89
3
Table S3. Multivariate results of the generalized linear models examining sexual selection on
the set of six phenotypic traits in the set of six study populations of the damselfly C. puella.
Significant p-values are indicated in bold.
Mating success
χ2
p
11.1845 0.048
0.0886
0.77
Population (Pop)
Phenoloxidase activity
df
5
1
Phenoloxidase activity2
Phenoloxidase activity × Pop
1
5
0.0341
6.5812
0.85
0.25
Phenoloxidase activity2 × Pop
Relative fat content
5
1
5.9323
4.0091
0.31
0.045
Relative fat content2
Relative fat content × Pop
1
5
0.4040
2.8340
0.53
0.73
Relative fat content 2 × Pop
Flight muscle ratio
5
1
7.7972
1.9615
0.17
0.16
Flight muscle ratio2
Flight muscle ratio × Pop
1
5
0.3459
6.3463
0.56
0.27
Flight muscle ratio2 × Pop
Wing length
5
1
13.8766
1.0029
0.016
0.32
Wing length2
Wing length × Pop
1
5
0.2425
12.1824
0.62
0.032
Wing length2 × Pop
Aspect ratio
5
1
2.1499
0.1330
0.83
0.72
Aspect ratio2
Aspect ratio × Pop
1
5
0.5591
8.3618
0.45
0.14
Aspect ratio2 × Pop
Wing loading
5
1
4.0946
0.9412
0.54
0.33
Wing loading2
Wing loading × Pop
1
5
2.7655
7.0017
0.096
0.22
Wing loading2 × Pop
5
6.6951
0.24
4
Figure S1. The left hind wing of a C. puella male with the 18 digitalized landmarks. Wing
size was measured as the distance between landmark 1 and 9.
5


