Boiling Point Lab Report: Identifying Mixtures
advertisement
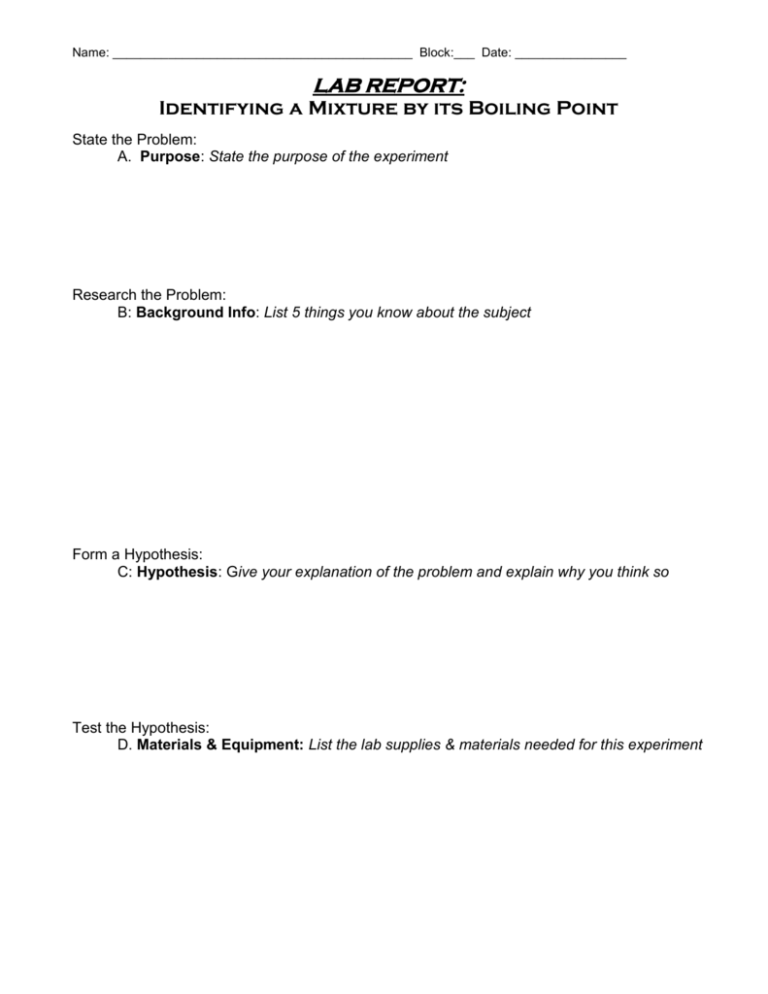
Name: ___________________________________________ Block:___ Date: ________________ LAB REPORT: Identifying a Mixture by its Boiling Point State the Problem: A. Purpose: State the purpose of the experiment Research the Problem: B: Background Info: List 5 things you know about the subject Form a Hypothesis: C: Hypothesis: Give your explanation of the problem and explain why you think so Test the Hypothesis: D. Materials & Equipment: List the lab supplies & materials needed for this experiment Name: ___________________________________________ Block:___ Date: ________________ E. Procedure: Explain what was done in this experiment to test your hypothesis (Drawings of lab set-up are often very helpful in this step) F. Results: Tell of observations made in the experiment, including data in the form of clearly explained charts, graphs, & tables Name: ___________________________________________ Block:___ Date: ________________ Data Table 1: Temperature of Each Mixture at Certain Times* Samples (grams of salt per 200 mL of water) Time 0g 5g 10 g 15 g 20 g 25 g UNKNOWN 30 g 35 g 30 g 35 g Trial 1 Trial 2 0 1 2 3 4 5 6 7 8 9 10 11 12 13 14 15 16 17 18 Data Table 2: Boiling Points of Each Mixture* Salt Water Sample Boiling Point 0g 5g 10 g 15 g 20 g 25 g UNKNOWN Name: ___________________________________________ Block:___ Date: ________________ Graph 1: Boiling Point v. Amount of Salt Boiling Point Temp (°C) Amount of Salt (g) per 200 mL Draw Conclusions from the Data: G. Analysis: Look at your data to see if it supported your hypothesis and make sure you answer the question that started the experiment (HOW MUCH SALT IS IN THE UNKNOWN?) Support your answer with your data and record any possible sources of error in your testing methods. Name: ___________________________________________ Block:___ Date: ________________ CHEAT SHEET & SPECIAL NOTES FOR THIS EXPERIMENT: LAB REPORT: Identifying a Mixture by its Boiling Point A. PURPOSE: The purpose of this experiment is to determine the amount of salt in an unknown sample by examining its boiling point. B. BACKGROUND INFO: List things you know about boiling and the temperature at which it occurs and what exactly happens when a substance boils. C. HYPOTHESIS: Inspect the unknown & hypothesize what it might be D. MATERIALS & EQUIPMENT: List all equipment used. EQUIPMENT & SAFETY CONCERNS: 1. 2. 3. 4. Goggles must be worn at all times to protect one’s eyes from any stray liquid!! Do not touch the hotplates or Erlenmeyer Flasks with skin – they will be hot!! Keep body parts clear of flask openings Protect the Equipment!!! a. Keep wires and thermometers away from hot plate surfaces. b. Do not expose any equipment to rapid temperature changes. E. PROCEDURE: Describe each step you took to perform this experiment. A good lab report would explain each detail clearly enough that any person off the street could pick it up and perform the experiment. For this experiment, be sure to include how the saltwater mixture was made. (ex: Dissolve 35 grams of salt in 200mL of water.) F. RESULTS: In performing the experiment, each liquid mixture should be placed on the hotplate at time equal to 0 min. The temperature should be recorded at this time. One should check the temperature every 1 or 2 minutes and record it in the data table. Once the temperature of the liquid stops rising, it has reached its boiling point. (To be absolutely certain, it is a good idea to wait until you have the same temperature reading for 3 minutes straight.) A graph is to be made of Boiling Point (on the y-axis) v. Amount of Salt (on the x-axis). (Share data with your neighbors in order to have more data points.) Draw a line of best fit through the data points. In the RESULTS section, one should also explain and reference the tables and graph, and clarify how they assist in organizing information for study. G. ANALYSIS: Be sure to accomplish the purpose of the experiment: Answer this question How much salt is in the unknown? Explain why using your data!!!! Also be sure to explain whether your hypothesis was supported or not. Be sure to list possible causes for error and ideas for improving this experiment.
