supplement
advertisement
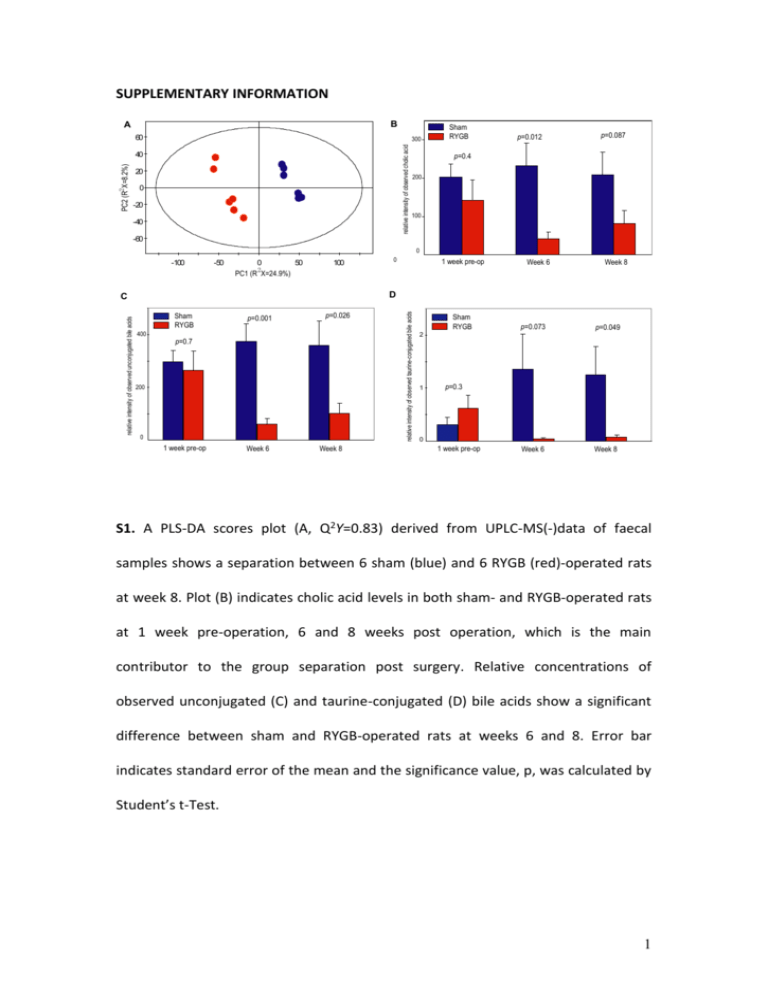
SUPPLEMENTARY INFORMATION B A 60 relative intensity of observed cholic acid 300 PC2 (R2 X=8.2%) 40 20 0 -20 -40 Sham RYGB p=0.012 p=0.087 p=0.4 200 100 -60 0 -100 -50 0 50 2 PC1 (R X=24.9%) 100 1 week pre-op Week 6 Week 8 Sham RYGB 400 p=0.001 p=0.026 p=0.7 200 0 1 week pre-op Week 6 Week 8 relative intensity of observed taurine-conjugated bile acids D C relative intensity of observed unconjugated bile acids 0 Sham RYGB p=0.073 p=0.049 Week 6 Week 8 2 1 p=0.3 0 1 week pre-op S1. A PLS-DA scores plot (A, Q2Y=0.83) derived from UPLC-MS(-)data of faecal samples shows a separation between 6 sham (blue) and 6 RYGB (red)-operated rats at week 8. Plot (B) indicates cholic acid levels in both sham- and RYGB-operated rats at 1 week pre-operation, 6 and 8 weeks post operation, which is the main contributor to the group separation post surgery. Relative concentrations of observed unconjugated (C) and taurine-conjugated (D) bile acids show a significant difference between sham and RYGB-operated rats at weeks 6 and 8. Error bar indicates standard error of the mean and the significance value, p, was calculated by Student’s t-Test. 1 S2. Phylogenetic tree (neighbor-joining from a jukes-cantor matrix) of the main taxonomic groups which varied between the two test groups, only the higher taxonomic groups from which they were clustered is shown. The barchart to the right of the tree shows the reads associated with a representative from its taxonomic group. * Enterobacter hormaechei. 2 Crn HP HP A Tau Cre/Crn Cit GT Suc Ace PAG FA IS AP Lac FM B Ala Lac BT AP BT PAG TMAO IS BT DMA PG MA HA HA PG AV PS PG MNA 9.0 MNA 8.5 8.0 AV Ala Lac MNA 7.5 7.0 4.5 4.0 3.5 3.0 2.0 1.5 1.0 ppm S3. Typical 600 MHz 1H NMR spectra of urine obtained from a sham control rat (A) and a Roux-en-Y Gastric Bypass (RYGB)-operated rat (B) 8-week post operation. The spectra in the aromatic region (δ1H 6.4-9.3) and the region δ1H 0.6-2.28 were magnified twice compared to the region δ1H 2.28-4.7. Keys: Ace: acetate; Ala: alanine; AP: 2-oxoadipate; AV: 5-aminovalerate; BT: butyrate; Cit: citrate; Cre: creatine; Crn: creatinine; DMA: dimethylamine; FA: formate; FM: fumarate; GT: 2oxoglutarate; HA: p-hydroxyphenylacetate; HP: hippurate; IS: indoxyl sulfate; Lac: lactate; MA: methylamine; MNA: 1-methylnicotinamide; PAG: phenylacetylglycine; PG: p-cresyl glucuronide; PS: p-cresyl sulfate; Suc: succinate; Tau: taurine; TMAO: trimethylamine N-oxide. 3 A OS/Amino acids Ace Ura Ura BT BT/PP AV AV Asp FA B Suc Gly MT Ura Phe Tyr FA Ura 8.0 7.5 6.5 4.5 Val/Ileu/Leu/PP GABA Glu BT Lac 7.0 GABA PT Ala Lac DE TMA MA 4.0 3.5 3.0 2.5 ET 2.0 1.5 1.0 ppm 4 S4. Typical 600 MHz 1H NMR spectra of faecal extracts obtained from a sham control rat (A) and a Roux-en-Y Gastric Bypass (RYGB)-operated rat (B) 8-week post operation. The spectra in the aromatic region (δ1H 5.75-8.5) were magnified 4 times compared to the region δ1H 0.5-4.7. Keys: Ace: acetate; Ala: alanine; AP: 2oxoadipate; Asp: aspartate; AV: 5-aminovalerate; BT: butyrate; DE: diaminoethane; ET: ethanol; FA: formate; FM: fumarate; GABA: -animo-N-butyrate; Glu: glutamate; Gly: glycine; Ileu: isoleucine; Lac: lactate; Leu: leucine; MA: methylamine; MT: methanol; OS: oligosaccharides; Phe: phenylalanine; PP: propionate; PT: putrescine; Suc: succinate; TMA: trimethylamine; Tyr: tyrosine; Ura: uracil; Val: valine. 5 0 7 4 PAG PG PG IS 7.5 IS PAG HA Cre HA 3 Cre PS PG 2 1 ppm 0.7 Correlation Coefficients (a.u.) 3 Asp 6 8 Ura Ura 4 PT MA 2 PT 1 Urine Feces S5. O-PLS regression loadings plot shows the correlation between the combination of urinary and faecal NMR spectral data and Enterobacter hormaechei (Q2Y=0.7; R2X=28%) level. 6 A 0.45 Urine HA PAG PS AV HA PS PG Cre Cre 7 7.4 7.8 AV PG PAG Correlation Coefficients (a.u.) Suc 4 2 2.5 3 3.5 0 1 ppm 1.5 0.5 Asp Feces Correlation Coefficients (a.u.) Asp PT MA PT Ura Ura 7.6 6.8 5.8 4 4.5 3.5 3 2 2.5 0 1 ppm 1.5 B C lostridiaceae(%) 18 80 14 70 12 60 10 50 8 40 6 30 4 20 2 10 0 0 200 250 300 350 400 Enterobacteriaceae(%) 90 16 450 500 0.05 4 0.04 3 0.03 2 0.02 200 250 300 350 400 450 0 500 0.01 200 250 Lachnospiraceae(%) 45 0.6 300 350 400 450 500 0 P as teurellaceae(%) 0.9 0.8 16 35 0.7 14 0.6 12 25 0.5 10 0.3 20 0.4 8 15 0.3 6 10 0.2 4 5 0.1 0.1 0 200 250 300 350 400 450 500 0 200 250 300 P revotellaceae(%) 40 50 45 35 40 450 500 R uminococcaceae(%) 15 250 300 350 400 body weight (g) 450 500 0 500 300 350 400 450 500 200 250 300 350 400 450 500 body weight (g) Veillonellaceae(%) 2 1 10 5 5 450 1.5 15 10 400 2.5 25 20 20 350 2 250 3 30 25 200 200 body weight (g) 35 30 0 400 body weight (g) body weight (g) 45 350 300 P orphyromonadaceae(%) 18 40 30 0.2 250 body weight (g) 0.4 0.5 200 body weight (g) body weight (g) Incertae Sedis XIII(%) Micrococcaceae(%) 0.06 5 1 body weight (g) 0.7 Lactobacillaceae(%) 6 0.5 200 250 300 350 400 body weight (g) 450 500 0 200 250 300 350 400 450 500 body weight (g) S6. (A) O-PLS regression coefficient plot derived from 1H NMR urinary (Q2Y=0.58; R2X=31.4%) and faecal (Q2Y=0.61; R2X=28%) spectral data against body weight. (B) 7 Scatter plots of bacterial family levels and body weight of rats (red: RYGB-operated; blue: sham control) at week 2 (circles) and 8 (stars). p = 0 .0 1 Aerococcaceae Alcaligenaceae Alteromonadaceae Bacillaceae Bacteroidaceae Bifidobacteriaceae Carnobacteriaceae Clostridiaceae Coriobacteriaceae Corynebacteriaceae Deferribacteraceae Desulfovibrionaceae Enterobacteriaceae Enterococcaceae Erysipelotrichaceae Eubacteriaceae Incertae Sedis XII Incertae Sedis XIII Lachnospiraceae Lactobacillaceae Methylobacteriaceae Methylococcaceae Microbacteriaceae Micrococcaceae Moraxellaceae Pasteurellaceae Peptococcaceae Peptostreptococcaceae Planococcaceae Porphyromonadaceae Prevotellaceae Pseudomonadaceae Rikenellaceae Ruminococcaceae Staphylococcaceae Streptococcaceae Veillonellaceae 0. 86 0. 69 0. 52 0. 35 0. 18 0. 01 -0. 15 -0. 32 -0. 49 -0. 66 PG PAG creatine PS methylamine putrescine uracil S7. Cross correlation plots between selected urinary and faecal metabolites and the abundance levels of 37 bacterial families across matched samples (correlations significant at p < 0.01) Key: PS, p-cresyl sulfate; PG, p-cresyl glucuronide; PAG, phenylacetylglycine. 8 Table S1 454 primers use to amplify the V1-V3 regions of the 16S rRNA gene, the portion in bold is the unique barcode (5mer) that distinguished each sample and allows for multiplexing of the sample on the 454. To the right of the barcode is the target primer which anneals to the 16S rRNA gene. Sample S1 S2 S3 S4 S5 S6 S7 S8 S9 S10 S11 S12 B1 B2 B3 B4 B5 B6 B7 B8 B9 B10 B11 B12 Forward primer and barcode in bold CCATCTCATCCCTGCGTGTCTCCGACTCAG GATCT GCCTAACACATGCAAGTC CCATCTCATCCCTGCGTGTCTCCGACTCAG ATCAG GCCTAACACATGCAAGTC CCATCTCATCCCTGCGTGTCTCCGACTCAG ACACT GCCTAACACATGCAAGTC CCATCTCATCCCTGCGTGTCTCCGACTCAG AGCTA GCCTAACACATGCAAGTC CCATCTCATCCCTGCGTGTCTCCGACTCAG CACAC GCCTAACACATGCAAGTC CCATCTCATCCCTGCGTGTCTCCGACTCAG ACAGA GCCTAACACATGCAAGTC CCATCTCATCCCTGCGTGTCTCCGACTCAG AGATG GCCTAACACATGCAAGTC CCATCTCATCCCTGCGTGTCTCCGACTCAG CACTG GCCTAACACATGCAAGTC CCATCTCATCCCTGCGTGTCTCCGACTCAG CAGAG GCCTAACACATGCAAGTC CCATCTCATCCCTGCGTGTCTCCGACTCAG CGCAG GCCTAACACATGCAAGTC CCATCTCATCCCTGCGTGTCTCCGACTCAG CTGTG GCCTAACACATGCAAGTC CCATCTCATCCCTGCGTGTCTCCGACTCAG GTGAG GCCTAACACATGCAAGTC CCATCTCATCCCTGCGTGTCTCCGACTCAG TCATG GCCTAACACATGCAAGTC CCATCTCATCCCTGCGTGTCTCCGACTCAG AGCAT GCCTAACACATGCAAGTC CCATCTCATCCCTGCGTGTCTCCGACTCAG CAGCT GCCTAACACATGCAAGTC CCATCTCATCCCTGCGTGTCTCCGACTCAG CATGT GCCTAACACATGCAAGTC CCATCTCATCCCTGCGTGTCTCCGACTCAG CTGAT GCCTAACACATGCAAGTC CCATCTCATCCCTGCGTGTCTCCGACTCAG CTGCA GCCTAACACATGCAAGTC CCATCTCATCCCTGCGTGTCTCCGACTCAG GATGA GCCTAACACATGCAAGTC CCATCTCATCCCTGCGTGTCTCCGACTCAG TACGC GCCTAACACATGCAAGTC CCATCTCATCCCTGCGTGTCTCCGACTCAG ACTGC GCCTAACACATGCAAGTC CCATCTCATCCCTGCGTGTCTCCGACTCAG GTCAC GCCTAACACATGCAAGTC CCATCTCATCCCTGCGTGTCTCCGACTCAG CGTAC GCCTAACACATGCAAGTC CCATCTCATCCCTGCGTGTCTCCGACTCAG TGCGT GCCTAACACATGCAAGTC Reverse primer CCTATCCCCTGTGTGCCTTGGCAGTCTCAG ATTACCGCGGCTGCTGG 9
