A CONSTANT RATE OF CHANGE
Name___________________________
A Recursive View of Some Common Functions – Part 1
You can represent functions in several ways – by using tables, graphs, and equations, for example. In
parts 1 and 2 of this investigation, you will examine representations of two fundamental types of
functions. Your goal, by the end of the investigation, is to find answers to these questions:
How can two different types of equations represent each function – the one that you examine in
part 1 and the one that you encounter in part 2?
How does each equation show fundamental properties of the function and its graph?
How do the equations help you see similarities and differences between the functions that you
encounter in parts 1 and 2?
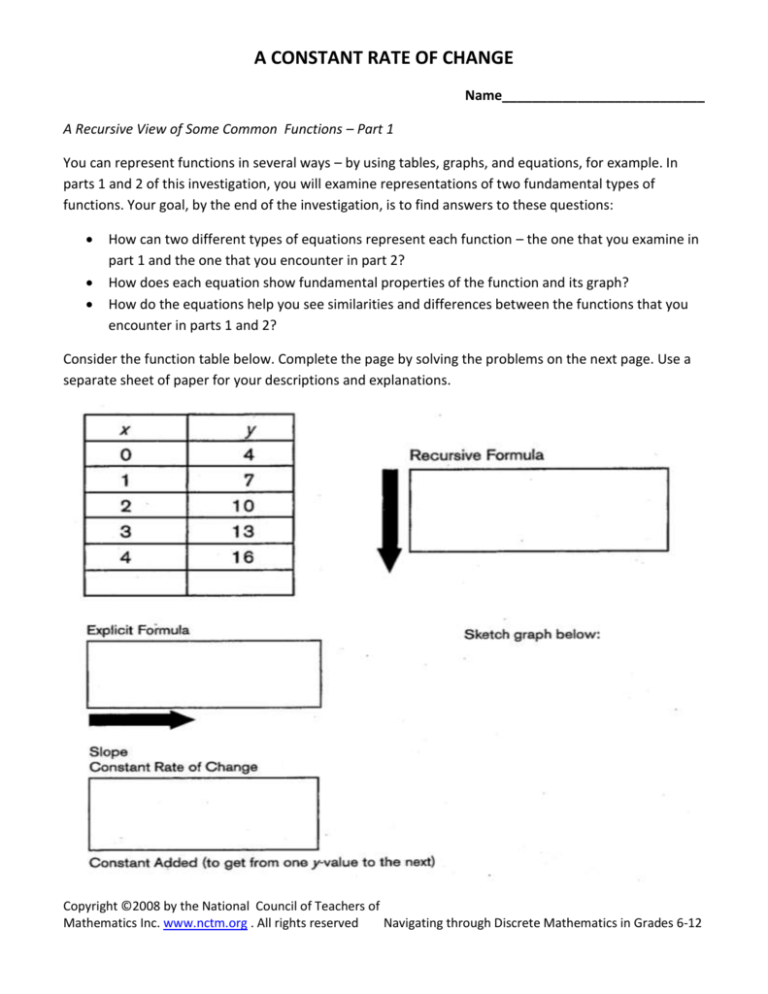
Consider the function table below. Complete the page by solving the problems on the next page. Use a
separate sheet of paper for your descriptions and explanations.
Copyright ©2008 by the National Council of Teachers of
Mathematics Inc. www.nctm.org . All rights reserved
Navigating through Discrete Mathematics in Grades 6-12
A Constant Rate of Change (continued)
1.Examine the function table on the previous page and briefly describe any patterns that you see.
2.Look down the column of y-values in the table. If NOW is the y-value at a particular place in the table
and NEXT is the y-value in the next row down, write an equation using NEXT and NOW that describes the
pattern in the y-values. Write this equation in the box next to the down arrow.
3.Create an additional column beside the column of y-values. Use this column to rewrite each y-value
using the number 4 and/or the value identified in the pattern. Describe the pattern you’ve discovered.
4.Using the last row of your table on the previous page, generalize the pattern indicating an expression
used to find the value of this function when x = n .
5.Use algebraic reasoning and the expression found above to write an equation of the form “y=…”
showing the relationship between x and the corresponding y. Write this equation on the previous page
in the box above the right arrow.
6.What type of function is represented by the table and by the equations that you have found? Describe
the basic characteristics of this function.
7.Sketch a small graph of this function in the location shown on the previous page. Slope is a
fundamental feature of the graph of a linear function. What is the slope of the graph of this function?
8.The slope of a graph of a linear function also shows the constant rate of change of y with respect to x.
Describe how the table shows this constant rate of change.
9.Examine the questions in the boxes on the previous page.
Describe how the slope and constant rate of change are shown in each of the two equations
Circle the number in those equations that corresponds to the slope. To show what the circled
number represents, draw an arrow from each circled number to the box at the bottom of the
page, and enter the number in the box.
Do you think that one equation shows the slope and constant rate of change more clearly than
the other? Explain.
10.Review your work. Explain all the information on the previous page to your classmates. In particular,
for each item, answer these questions.
What is it?
How is it determined?
What does it mean?
How does it connect with other information on the page?
Copyright ©2008 by the National Council of Teachers of
Mathematics Inc. www.nctm.org . All rights reserved
Navigating through Discrete Mathematics in Grades 6-12
A CONSTANT MULTIPLIER
Name___________________________________
A Recursive View of Some Common Functions – Part 2
In part 1 of this investigation, you examined representations of a linear function. In part 2, you will
examine representations of a function of a different fundamental type. Recall that your goal, by the end
of the investigation, is to find answers to these questions:
How can two different types of equations represent each function – the one that you examine in
part 1 and the one that you encounter in part 2?
How does each equation show fundamental properties of the function and its graph?
How do the equations help you see similarities and differences between the functions that you
encounter in parts 1 and 2?
Consider the function table below. Your task is to complete the page by solving the problems on the
next page. Use a separate sheet of paper for your descriptions and explanations. When you are finished,
you will compare this work with the work that you did in part 1 of this investigation.
Copyright ©2008 by the National Council of Teachers of
Mathematics Inc. www.nctm.org . All rights reserved
Navigating through Discrete Mathematics in Grades 6-12
A Constant Multiplier (continued)
1.Examine the function table on the previous page and briefly describe any patterns that you see.
2.Look down the column of y-values in the function table. If NOW is the y-value at a particular place in
the table and NEXT is the y-value in the next row down, write an equation using NEXT and NOW that
describes the pattern in the y-values. Write this equation in the box next to the down-arrow.
3.Create an additional column beside the column of y-values. Use this column to rewrite each y-value
using the number 4 and/or the value identified in the pattern. Describe the pattern you discovered.
4.Using the last row of your table on the previous page, generalize the pattern indicating an expression
used to find the value of this function when x=n.
5.Use algebraic reasoning and the expression found above to write an equation in the form “y=…”
showing the relationship between x and the corresponding y. Write this equation on the previous page
in the box above the right-arrow.
6.What type of function is represented by the table and by the equations that you have found? Desribe
the basic characteristics of this function.
7.Sketch a small graph of this function in the location shown on the previous page. Does the graph have
a constant slope? Is there a constant rate of change of y with respect to x? Explain.
8.A fundamental characteristic of exponential functions is that there is a constant multiplier. Describe
how the table shows the constant multiplier.
9.Examine the equations in the boxes on the previous page.
Describe how the constant multiplier is shown in each of the equations
Circle the number in those equations that corresponds to the constant multiplier. To show what
the number represents, draw an arrow from each circled number to the box at the bottom of the
page, and enter the number in the box.
Do you think that one equation shows the constant multiplier more clearly than the other?
Explain.
10.Review your work. Explain all the information on the previous page to your classmates. In particular,
for each item, answer these questions:
What is it?
How is it determined?
What does it mean?
How does it connect with other information on the page?
Copyright ©2008 by the National Council of Teachers of
Mathematics Inc. www.nctm.org . All rights reserved
Navigating through Discrete Mathematics in Grades 6-12
11.Compare the NEXT-NOW equations that you wrote in part 1 (“A constant rate of change”) and part
2(“a constant multiplier”). These equations are recursive formulas, since they describe one value in
terms of the previous value.
a. Describe how these two NEXT-NOW equations are similar and how they are different
b. How do the y=… equations that you wrote in part 1 and part 2 show this difference? (These equations
are explicit, or closed-form, formulas)
c. How do the graphs of the two functions show this difference?
d. How do the tables for the two functions show this difference?
12.Write a paragraph describing linear and exponential functions, compare function types and describe
a contextual situation that could represent each.
Copyright ©2008 by the National Council of Teachers of
Mathematics Inc. www.nctm.org . All rights reserved
Navigating through Discrete Mathematics in Grades 6-12


