PrSet02
advertisement
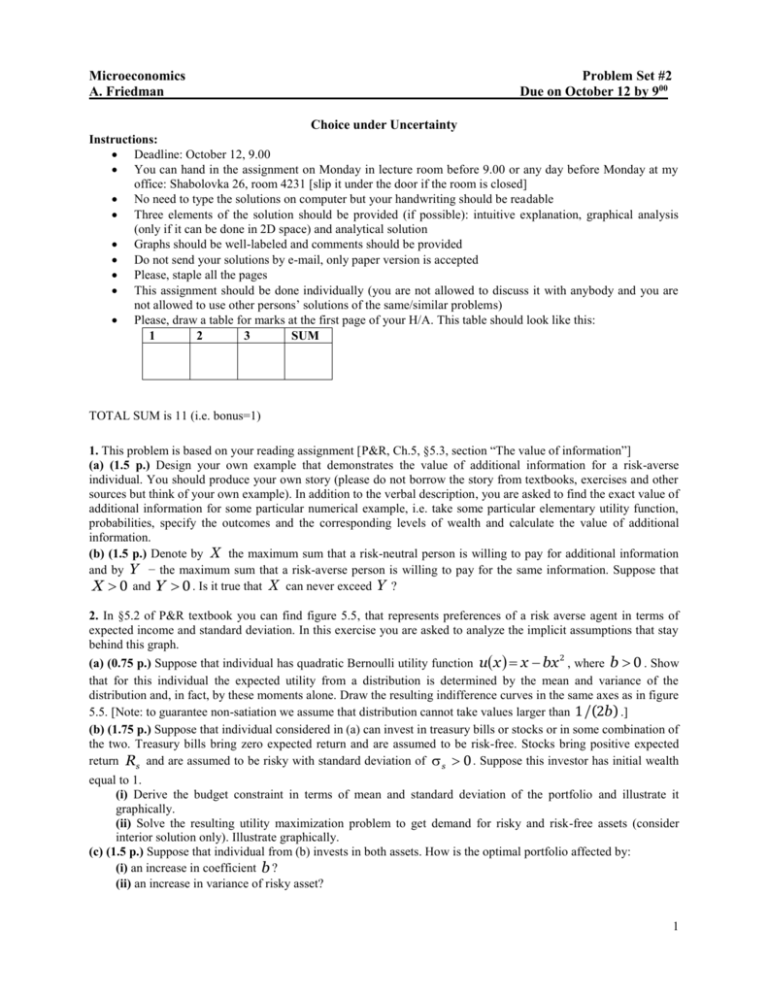
Microeconomics A. Friedman Problem Set #2 Due on October 12 by 900 Choice under Uncertainty Instructions: Deadline: October 12, 9.00 You can hand in the assignment on Monday in lecture room before 9.00 or any day before Monday at my office: Shabolovka 26, room 4231 [slip it under the door if the room is closed] No need to type the solutions on computer but your handwriting should be readable Three elements of the solution should be provided (if possible): intuitive explanation, graphical analysis (only if it can be done in 2D space) and analytical solution Graphs should be well-labeled and comments should be provided Do not send your solutions by e-mail, only paper version is accepted Please, staple all the pages This assignment should be done individually (you are not allowed to discuss it with anybody and you are not allowed to use other persons’ solutions of the same/similar problems) Please, draw a table for marks at the first page of your H/A. This table should look like this: 1 2 3 SUM TOTAL SUM is 11 (i.e. bonus=1) 1. This problem is based on your reading assignment [P&R, Ch.5, §5.3, section “The value of information”] (a) (1.5 p.) Design your own example that demonstrates the value of additional information for a risk-averse individual. You should produce your own story (please do not borrow the story from textbooks, exercises and other sources but think of your own example). In addition to the verbal description, you are asked to find the exact value of additional information for some particular numerical example, i.e. take some particular elementary utility function, probabilities, specify the outcomes and the corresponding levels of wealth and calculate the value of additional information. (b) (1.5 p.) Denote by X the maximum sum that a risk-neutral person is willing to pay for additional information and by Y − the maximum sum that a risk-averse person is willing to pay for the same information. Suppose that X 0 and Y 0 . Is it true that X can never exceed Y ? 2. In §5.2 of P&R textbook you can find figure 5.5, that represents preferences of a risk averse agent in terms of expected income and standard deviation. In this exercise you are asked to analyze the implicit assumptions that stay behind this graph. (a) (0.75 p.) Suppose that individual has quadratic Bernoulli utility function ux x bx 2 , where b 0 . Show that for this individual the expected utility from a distribution is determined by the mean and variance of the distribution and, in fact, by these moments alone. Draw the resulting indifference curves in the same axes as in figure 5.5. [Note: to guarantee non-satiation we assume that distribution cannot take values larger than 1 /(2b) .] (b) (1.75 p.) Suppose that individual considered in (a) can invest in treasury bills or stocks or in some combination of the two. Treasury bills bring zero expected return and are assumed to be risk-free. Stocks bring positive expected return Rs and are assumed to be risky with standard deviation of s 0 . Suppose this investor has initial wealth equal to 1. (i) Derive the budget constraint in terms of mean and standard deviation of the portfolio and illustrate it graphically. (ii) Solve the resulting utility maximization problem to get demand for risky and risk-free assets (consider interior solution only). Illustrate graphically. (c) (1.5 p.) Suppose that individual from (b) invests in both assets. How is the optimal portfolio affected by: (i) an increase in coefficient b ? (ii) an increase in variance of risky asset? 1 3. A farmer can grow wheat or potatoes or both. If the summer is shiny then a unit of land yields a profit of $7 if devoted to wheat, of $3 if devoted to potatoes. Should the summer be rainy, a unit of land yields a profit of $1 if devoted to wheat, of $3 if devoted to potatoes. Good and bad weather is equally likely. Farmer is risk averse and has 40 units of land. Let the farmer’s utility function be given by u x 4 x , where x stays for wealth. (a) (1 p.) What is the optimal allocation of land between potatoes and wheat. Illustrate graphically and explain the result intuitively. (b) (1.5 p.) Suppose that farmer is offered to rent his land out for one period for X rubles. Find the smallest X at which the farmer would accept the offer. Denote this sum by X min and illustrate graphically. Compare X min with the one period expected profit from his business and explain the result. (c) (1.5 p.) Now, suppose that the farmer can purchase an insurance against bad weather that pays $1 per unit of insurance in case of bad weather at a price of $0.5 per unit. Find the optimal allocation of land and the quantity of insurance purchased. Illustrate graphically and explain the result intuitively. 2
