B. 1 H NMR studies for the SGQs formed by mAGi as a
advertisement
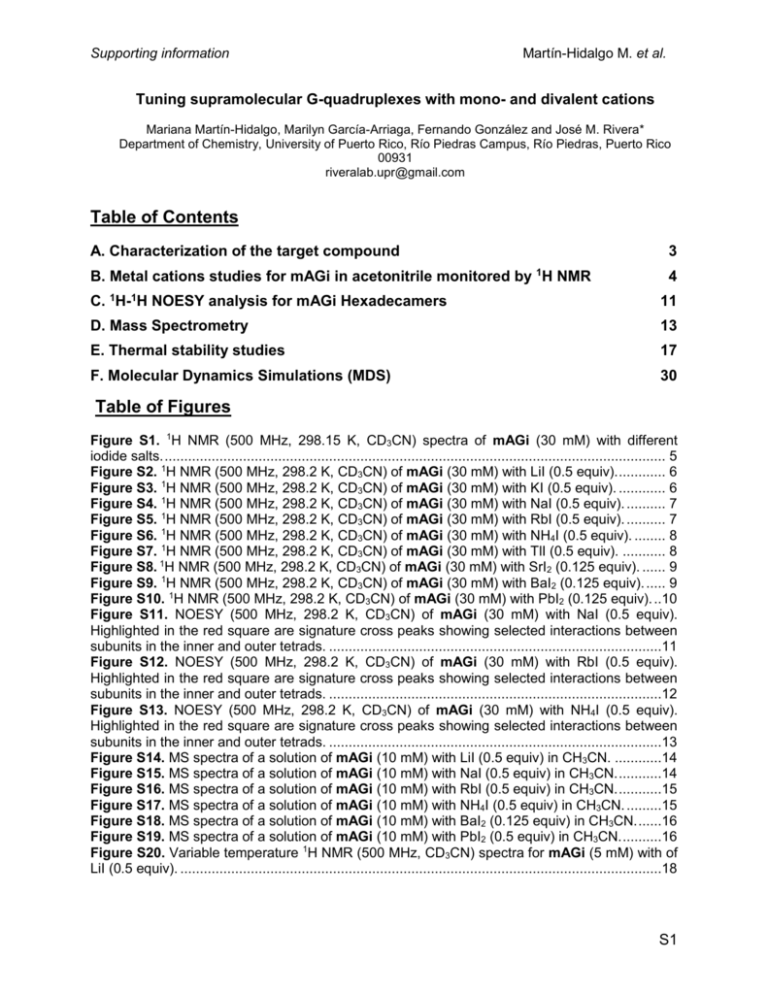
Supporting information Martín-Hidalgo M. et al. Tuning supramolecular G-quadruplexes with mono- and divalent cations Mariana Martín-Hidalgo, Marilyn García-Arriaga, Fernando González and José M. Rivera* Department of Chemistry, University of Puerto Rico, Río Piedras Campus, Río Piedras, Puerto Rico 00931 riveralab.upr@gmail.com Table of Contents A. Characterization of the target compound 3 B. Metal cations studies for mAGi in acetonitrile monitored by 1H NMR 4 C. 1H-1H NOESY analysis for mAGi Hexadecamers 11 D. Mass Spectrometry 13 E. Thermal stability studies 17 F. Molecular Dynamics Simulations (MDS) 30 Table of Figures Figure S1. 1H NMR (500 MHz, 298.15 K, CD3CN) spectra of mAGi (30 mM) with different iodide salts. ................................................................................................................................ 5 Figure S2. 1H NMR (500 MHz, 298.2 K, CD3CN) of mAGi (30 mM) with LiI (0.5 equiv). ............ 6 Figure S3. 1H NMR (500 MHz, 298.2 K, CD3CN) of mAGi (30 mM) with KI (0.5 equiv). ............ 6 Figure S4. 1H NMR (500 MHz, 298.2 K, CD3CN) of mAGi (30 mM) with NaI (0.5 equiv). .......... 7 Figure S5. 1H NMR (500 MHz, 298.2 K, CD3CN) of mAGi (30 mM) with RbI (0.5 equiv). .......... 7 Figure S6. 1H NMR (500 MHz, 298.2 K, CD3CN) of mAGi (30 mM) with NH4I (0.5 equiv). ........ 8 Figure S7. 1H NMR (500 MHz, 298.2 K, CD3CN) of mAGi (30 mM) with TlI (0.5 equiv). ........... 8 Figure S8. 1H NMR (500 MHz, 298.2 K, CD3CN) of mAGi (30 mM) with SrI2 (0.125 equiv). ...... 9 Figure S9. 1H NMR (500 MHz, 298.2 K, CD3CN) of mAGi (30 mM) with BaI2 (0.125 equiv). ..... 9 Figure S10. 1H NMR (500 MHz, 298.2 K, CD3CN) of mAGi (30 mM) with PbI2 (0.125 equiv). ..10 Figure S11. NOESY (500 MHz, 298.2 K, CD3CN) of mAGi (30 mM) with NaI (0.5 equiv). Highlighted in the red square are signature cross peaks showing selected interactions between subunits in the inner and outer tetrads. .....................................................................................11 Figure S12. NOESY (500 MHz, 298.2 K, CD3CN) of mAGi (30 mM) with RbI (0.5 equiv). Highlighted in the red square are signature cross peaks showing selected interactions between subunits in the inner and outer tetrads. .....................................................................................12 Figure S13. NOESY (500 MHz, 298.2 K, CD3CN) of mAGi (30 mM) with NH4I (0.5 equiv). Highlighted in the red square are signature cross peaks showing selected interactions between subunits in the inner and outer tetrads. .....................................................................................13 Figure S14. MS spectra of a solution of mAGi (10 mM) with LiI (0.5 equiv) in CH3CN. ............14 Figure S15. MS spectra of a solution of mAGi (10 mM) with NaI (0.5 equiv) in CH3CN. ...........14 Figure S16. MS spectra of a solution of mAGi (10 mM) with RbI (0.5 equiv) in CH3CN. ...........15 Figure S17. MS spectra of a solution of mAGi (10 mM) with NH4I (0.5 equiv) in CH3CN. .........15 Figure S18. MS spectra of a solution of mAGi (10 mM) with BaI2 (0.125 equiv) in CH3CN. ......16 Figure S19. MS spectra of a solution of mAGi (10 mM) with PbI2 (0.5 equiv) in CH3CN. ..........16 Figure S20. Variable temperature 1H NMR (500 MHz, CD3CN) spectra for mAGi (5 mM) with of LiI (0.5 equiv). ...........................................................................................................................18 S1 Supporting information Martín-Hidalgo M. et al. Figure S21. Variable temperature 1H NMR (500 MHz, CD3CN) spectra for mAGi (5 mM) with of NaI (0.5 equiv). .........................................................................................................................19 Figure S22. Melting profile (solid line) and first derivative curve (dashed line) as determined by VT-NMR for mAGi (5 mM) with NaI (0.5 equiv) .........................................................................20 Figure S23. Variable temperature 1H NMR (500 MHz, CD3CN) spectra for mAGi (5 mM) with of RbI (0.5 equiv). .........................................................................................................................21 Figure S24. Melting profile (solid line) as determined by VT-NMR for mAGi (5 mM) with RbI (0.5 equiv). ................................................................................................................................22 Figure S25. Variable temperature 1H NMR (500 MHz, CD3CN) spectra for mAGi (5 mM) with of NH4I (0.5 equiv).........................................................................................................................23 Figure S26. Melting profile (solid line) and first derivative curve (dashed line) as determined by VT-NMR for mAGi (5 mM) with NH4I (0.5 equiv). ......................................................................24 Figure S27. Variable temperature 1H NMR (500 MHz, CD3CN) spectra for mAGi (5 mM) with of TlI (0.5 equiv). ...........................................................................................................................25 Figure S28. Melting profile (solid line) and first derivative curve (dashed line) as determined by VT-NMR for mAGi (5 mM) with TlI (0.5 equiv). .........................................................................26 Figure S29. Variable temperature 1H NMR (500 MHz, CD3CN) spectra for mAGi (5 mM) with of BaI2 (0.125 equiv). ....................................................................................................................27 Figure S30. Melting profile as determined by VT-NMR for mAGi (5 mM) with BaI2 (0.125 equiv). .................................................................................................................................................28 Figure S31. Variable temperature 1H NMR (500 MHz, 298.2 K in CD3CN) spectra for mAGi (5 mM) with of PbI2 (0.5 equiv). .....................................................................................................29 Figure S32. Melting profile (solid line) and first derivative curve (dashed line) as determined by VT-NMR for mAGi (5 mM) with PbI2 (0.5 equiv). .......................................................................30 Figure S33. Supramolecular structures of mAGi16 with: a) Na+; b) Rb+; c) Li+; d) NH4+; e) Cs+. 33 Figure S34. Histogram plots of the distribution of the root mean square displacements of mAGi hexadecamer. a) K+; b) Na+; c) Rb+; d) Li+; e) NH4+; f) Cs+. The color code and labels are the same as in the main text. ..........................................................................................................34 Figure S35. a) Trajectory of the dynamics of mAGi8 with Li+(yellow) using the structure with K+ (orange) as a reference; b) distribution of the corresponding RMSD values from a. ..................34 Figure S36. Supramolecular structure for mAGi8•Li+ ................................................................35 Figure S37. Histogram plots of the distribution of the root mean square displacements of mAGi8 a) K+ (orange) and b) Li+ (yellow). The color code and labels are the same as in the main text. 35 S2 Supporting information Martín-Hidalgo M. et al. A. Characterization of the target compound NMR spectra were recorded on Bruker DRX-500 or AV-500 spectrometer, equipped with either a 5 mm BBO or a TXI probe and with nominal frequencies of 500.13 MHz for proton and 125.77 MHz for carbon respectively. All NMR experiments were performed at 298.15 K unless otherwise stated. All the assemblies were characterized with 1H NMR and 2D NMR techniques such as COSY and NOESY. The synthesis and characterization for mAGi was reported in Gubala, V.; Betancourt, J. E.; Rivera, J. M. Org. Lett. 2004, 6, 4735-4738. S3 Supporting information Martín-Hidalgo M. et al. B. 1H NMR studies for the SGQs formed by mAGi as a function of different cations in acetonitrile Different monovalent and divalent cations were used to promote the cation-templated self-assembly of mAGi. The addition of 0.5 equiv of LiI, NaI, KI, RbI, CsI, TlI, PbI2 and 0.125 equiv of SrI2, BaI2cations into 30 mM solutions of the analoguesin CD3CN yield the formation of different SGQs, fidelities from moderate to high were observed (Table S1).1 Table S1. Type and relative amounts (fidelity) of SGQs formed by mAGi (30 mM) determined by 1H NMR (0.5 equiv of LiI, NaI, KI, RbI, CsI, TlI, PbI 2 and 0.125 equiv of SrI2 and BaI2, at 298.15 K) in CD3CN. Monomer Cation mAGi Li+ Na+ K+ Rb+ NH4+ Cs+ Tl+ Sr2+ Ba2+ Pb2+ Assembly (%) OD4 H US 95 5 95 5 90 10 67 33 86 14 100 58 42 100 90 10 77 23 Note: O = Octamer; H = Hexadecamer; US = Unidentified Species All measurements have an estimated 5% error 1. Fidelity refers to the percentage of the desired supramolecule when there are two or more potential outcomes. For more information see: Todd, E. M.; Quinn, J. R.; Park, T.; Zimmerman, S. C., Fidelity in the supramolecular assembly of triply and quadruply hydrogen-bonded complexes. I. J. Chem. 2005, 45, 381389. S4 Supporting information Martín-Hidalgo M. et al. Figure S1. 1H NMR (500 MHz, 298.15 K, CD3CN) spectra of mAGi (30 mM) with different iodide salts. S5 Supporting information Martín-Hidalgo M. et al. Figure S2. 1H NMR (500 MHz, 298.2 K, CD3CN) of mAGi (30 mM) with LiI (0.5 equiv). Figure S3. 1H NMR (500 MHz, 298.2 K, CD3CN) of mAGi (30 mM) with KI (0.5 equiv). S6 Supporting information Martín-Hidalgo M. et al. Figure S4. 1H NMR (500 MHz, 298.2 K, CD3CN) of mAGi (30 mM) with NaI (0.5 equiv). Figure S5. 1H NMR (500 MHz, 298.2 K, CD3CN) of mAGi (30 mM) with RbI (0.5 equiv). S7 Supporting information Martín-Hidalgo M. et al. Figure S6. 1H NMR (500 MHz, 298.2 K, CD3CN) of mAGi (30 mM) with NH4I (0.5 equiv). Figure S7. 1H NMR (500 MHz, 298.2 K, CD3CN) of mAGi (30 mM) with TlI (0.5 equiv). S8 Supporting information Martín-Hidalgo M. et al. Figure S8. 1H NMR (500 MHz, 298.2 K, CD3CN) of mAGi (30 mM) with SrI2 (0.125 equiv). Figure S9. 1H NMR (500 MHz, 298.2 K, CD3CN) of mAGi (30 mM) with BaI2 (0.125 equiv). S9 Supporting information Martín-Hidalgo M. et al. Figure S10. 1H NMR (500 MHz, 298.2 K, CD3CN) of mAGi (30 mM) with PbI2 (0.125 equiv). S10 Supporting information Martín-Hidalgo M. et al. C. 1H-1H NOESY analysis for mAGi Hexadecamers A phase-sensitive 2D-NOESY pulse sequences with gradients (noesygpph) and a mixing time of 500 ms were used. NMR cuts of the characteristics NOE’s observed between the interphases of the outer and inner tetrads of the hexadecamers form by mAGi (30mM) with NaI, KI and RbI (1/2 equiv with respect to the monomer) in CD3CN at 298.15 K are shown. Figure S11. NOESY (500 MHz, 298.2 K, CD3CN) of mAGi (30 mM) with NaI (0.5 equiv). Highlighted in the red square are signature cross peaks showing selected interactions between subunits in the inner and outer tetrads. S11 Supporting information Martín-Hidalgo M. et al. Figure S12. NOESY (500 MHz, 298.2 K, CD3CN) of mAGi (30 mM) with RbI (0.5 equiv). Highlighted in the red square are signature cross peaks showing selected interactions between subunits in the inner and outer tetrads. S12 Supporting information Martín-Hidalgo M. et al. Figure S13. NOESY (500 MHz, 298.2 K, CD3CN) of mAGi (30 mM) with NH4I (0.5 equiv). Highlighted in the red square are signature cross peaks showing selected interactions between subunits in the inner and outer tetrads. D. Mass Spectrometry High resolution electrospray ionization mass spectrometry (ESI MS) was recorded on a Q-Tof Ultima Global mass spectrometer (Micromass) equipped with a Z-spray source. Electrospray ionization was achieved in the positive mode by 3 kV on the needle. 10 mM solutions of monomer in acetonitrile with 0.5 equiv (0.125 equiv for Ba2+) or of the corresponding metal cation, at room temperature, were directly and continuously infused at a flow rate of 5 µL/min with a syringe pump. The source block temperature was maintained at 60 °C and the desolvation gas was heated to 80 °C. Argon was used as the collision gas and the cone voltage was set to 35 V. The mass spectrometer was operated in the S13 Supporting information Martín-Hidalgo M. et al. mass range 0-4000 amu. Figure S14. MS spectra of a solution of mAGi (10 mM) with LiI (0.5 equiv) in CH3CN. Figure S15. MS spectra of a solution of mAGi (10 mM) with NaI (0.5 equiv) in CH3CN. S14 Supporting information Martín-Hidalgo M. et al. Figure S16. MS spectra of a solution of mAGi (10 mM) with RbI (0.5 equiv) in CH3CN. Figure S17. MS spectra of a solution of mAGi (10 mM) with NH4I (0.5 equiv) in CH3CN. S15 Supporting information Martín-Hidalgo M. et al. Figure S18. MS spectra of a solution of mAGi (10 mM) with BaI2 (0.125 equiv) in CH3CN. Figure S19. MS spectra of a solution of mAGi (10 mM) with PbI2 (0.5 equiv) in CH3CN. S16 Supporting information Martín-Hidalgo M. et al. E. Thermal stability studies Variable temperature experiments were performed at 5 mM of mAGi. At this particular concentration there is enough monomer and self-assembled species to enable the construction of a melting profile (with the exception of Lithium sample). Integration of the area under the H1’ peaks and the first derivative calculations allows a good approximation of the melting temperature for the assemblies. The fraction () of assembly (fidelity) = XSA/XT , is reported as the ratio between the total self-assembled species (XSA) and the total concentration of mAGi (XT), see figures for more information. Table S2. Melting temperatures (Tm) for various SGQs (O: octamer; H: hexadecamer) formed by mAGi (5 mM) as promoted by various cations. Cation LiI NaI KI RbI NH4I TlI SrI2 BaI2 PbI2 Molecularity O H H H H O O O O Tm ND* 309 329 ND* 310 304 333 333 313 * ND: Not determined; under the conditions of the experiments the Tm values for these samples could not be determined. All the Tm values are within an estimated 5% error. S17 Supporting information Martín-Hidalgo M. et al. Figure S20. Variable temperature 1H NMR (500 MHz, CD3CN) spectra for mAGi (5 mM) with of LiI (0.5 equiv). S18 Supporting information Martín-Hidalgo M. et al. Figure S21. Variable temperature 1H NMR (500 MHz, CD3CN) spectra for mAGi (5 mM) with of NaI (0.5 equiv). S19 Supporting information Martín-Hidalgo M. et al. Figure S22. Melting profile (solid line) and first derivative curve (dashed line) as determined by VT-NMR for mAGi (5 mM) with NaI (0.5 equiv) S20 Supporting information Martín-Hidalgo M. et al. Figure S23. Variable temperature 1H NMR (500 MHz, CD3CN) spectra for mAGi (5 mM) with of RbI (0.5 equiv). S21 Supporting information Martín-Hidalgo M. et al. Figure S24. Melting profile (solid line) as determined by VT-NMR for mAGi (5 mM) with RbI (0.5 equiv). S22 Supporting information Martín-Hidalgo M. et al. Figure S25. Variable temperature 1H NMR (500 MHz, CD3CN) spectra for mAGi (5 mM) with of NH4I (0.5 equiv). S23 Supporting information Martín-Hidalgo M. et al. Figure S26. Melting profile (solid line) and first derivative curve (dashed line) as determined by VT-NMR for mAGi (5 mM) with NH4I (0.5 equiv). S24 Supporting information Martín-Hidalgo M. et al. Figure S27. Variable temperature 1H NMR (500 MHz, CD3CN) spectra for mAGi (5 mM) with of TlI (0.5 equiv). S25 Supporting information Martín-Hidalgo M. et al. Figure S28. Melting profile (solid line) and first derivative curve (dashed line) as determined by VT-NMR for mAGi (5 mM) with TlI (0.5 equiv). S26 Supporting information Martín-Hidalgo M. et al. Figure S29. Variable temperature 1H NMR (500 MHz, CD3CN) spectra for mAGi (5 mM) with of BaI2 (0.125 equiv). S27 Supporting information Martín-Hidalgo M. et al. Figure S30. Melting profile as determined by VT-NMR for mAGi (5 mM) with BaI2 (0.125 equiv). S28 Supporting information Martín-Hidalgo M. et al. Figure S31. Variable temperature 1H NMR (500 MHz, 298.2 K in CD3CN) spectra for mAGi (5 mM) with of PbI2 (0.5 equiv). S29 Supporting information Martín-Hidalgo M. et al. Figure S32. Melting profile (solid line) and first derivative curve (dashed line) as determined by VT-NMR for mAGi (5 mM) with PbI2 (0.5 equiv). F. Molecular Dynamics Simulations (MDS) Initially, the structures of all the monomers were built using Maestro 8.0.315. These monomers were used to construct various SGQs that were manually assembled into supramolecular structures. The coordinates for these initial configurations were in accordance with the structural information obtained from the 2D NOESY spectrum of the various supramolecular GQs studied in our laboratory. Energy minimizations were performed to these SGQS using the MacroModel suite of programs employing the AMBER 94 force field.2 From these optimized structures two different configurations of the monomer (the structure of the monomer in the inner and outer tetramers) were used to derive electrostatic charges using the standard procedure for the AMBER force field, as 2. MacroModel Version 9.5, Maestro 8.0.315; Schrödinger, LLC: New York, NY, 2007. S30 Supporting information Martín-Hidalgo M. et al. implemented in RED III.3 Briefly, the procedure followed various steps: (i) each monomer was optimized using the HF/6-31G* method, from Gaussian 03 package; (ii) frequency calculations were performed to verify the identity of each stationary point as a minimum; (iii) the minimized structure was used to obtain the charges of each atom using the ESP software. In this calculation the charges corresponding to the sugar and the guanine moiety were fixed according to the force field. When the AMBER force field parameters were not available for particular atoms, the GAFF force field parameters were used. One, two and three cations were placed between G-tetrads using Maestro.4 Xleap was used to import the pdb and add the corresponding counterion (Cl-), using the addions2 command, to neutralize the system. A 10 Å truncated octahedron, with a minimum distance of 10 Å from the molecular surface to the boundaries surface, using CH3CN as solvent, was added to solvate the structure giving a total system of approximate 4704 atoms in the case of the mAGi16. The molecular dynamics simulations were carried out using the AMBER 10 suite of programs with the AMBER-99SB, as modified by Sponer.5 The atoms in the simulation were given a 12 Å cut-off and the particle mesh Ewald method was implemented to treat the long range electrostatics and to reduce the negative effects of the introduction of the cut-off. The temperature and pressure were fixed 300 K and 1 atm, respectively. SANDER was used to carry out the minimizations and the molecular dynamics runs. The total simulation time was 10 ns. VMD was 3. (a) Cornell, W. D.; Cieplak, P.; Baily, C. I.; Gould, I. R.; K. M. Merz, J.; Ferguson, D. C.; Fox, T.; Caldwell, J. W.; Kollman., P. A., A second generation force field for the simulation of proteins, nucleic acids, and organic molecules. J. Am. Chem. Soc. 1995, 117, 5179–5197. (b) Dupradeau, F. Y.; Pigache, A.; Zaffran, T.; Savineau, C.; Lelong, R.; Grivel, N.; Lelong, D.; Rosanski, W.; Cieplak, P., The R.E.D. tools: Advances in RESP and ESP charge derivation and force field library building. Phys. Chem. Chem. Phys. 2010, 12, 7821-7839. (c) Cieplak, P.; Cornell, W. D.; Bayly, C.; Kollman, P. A., Application of tne multimolecule and multiconformational RESP methodology to biopolymers - charge derivation for DNA, RNA, and proteins J. Comput. Chem. 1995, 16 (11), 1357-1377. 4. Maestro Version 9.5, Maestro 8.0.315; Schrödinger, LLC: New York, NY, 2007. 5. Pearlman, D. A.; Case, D. A.; Caldwell, J. W.; Ross, W. S.; T.E. Cheatham, I.; DeBolt, S.; Ferguson, D.; Seibel, G.; Kollman, P., AMBER, a package of computer programs for applying molecular mechanics, normal mode analysis, molecular dynamics and free energy calculations to simulate the structural and energetic properties of molecules. Comp. Phys. Commun. 1995, 91, 1-41. S31 Supporting information Martín-Hidalgo M. et al. used for graphical representations of the generated trajectories.6 As in previous studies, the variation of RMSD as a function of time was used as an indication of the stability of the system. Specifically, increments in RMSD values imply a deviation from the initial structure, which in this study was based on 2D NOESY experiments. As the deviation increases, the system diverges more from the experimental structure, and hence becomes less stable. For the statistical analysis (histogram plots) of the distribution of the root mean square deviations for all the structures were generated. Using a maximum number of counts of 4500 for all the structures, with bin sizes of 70. These plots are in agreement with the one shown in the text by means of a probability density representation. 6. Humphrey, W.; Dalke, A.; Schulten, K., VMD: visual molecular dynamics. J. Mol. Graph. 1996, 14 (1), 33-38. S32 Supporting information a. c. Martín-Hidalgo M. et al. b. d. e. Figure S33. Supramolecular structures of mAGi16 with: a) Na+; b) Rb+; c) Li+; d) NH4+; e) Cs+. S33 Supporting information b. c. 4000 4000 3500 3500 3500 3000 3000 3000 2500 2500 2500 Count Count 4000 2000 1500 Count a. Martín-Hidalgo M. et al. 2000 1500 2000 1500 1000 1000 1000 500 500 500 0 0 0 2.4 4.8 7.2 9.6 12 0 2.4 RMSD (Å) 9.6 0 0 12 3500 3500 3000 3000 3000 2500 2500 2500 Count 4000 3500 1500 2000 1500 1000 1000 500 500 7.2 9.6 0 0 12 RMSD (Å) 12 9.6 12 1500 500 4.8 9.6 2000 1000 2.4 7.2 f. e. 2000 4.8 RMSD (Å) 4000 0 0 2.4 RMSD (Å) 4000 Count 7.2 Count d. 4.8 2.4 4.8 7.2 9.6 0 0 12 2.4 4.8 7.2 RMSD (Å) RMSD (Å) Figure S34. Histogram plots of the distribution of the root mean square displacements of various hexadecamers mAGi16•3X+ for X = a) K+; b) Na+; c) Rb+; d) Li+; e) NH4+; f) Cs+. The color code and labels are the same as in the main text. a. b. 8 Probability Density (arb. units) 7 RMSD (Å) 6 5 4 3 2 1 0 0 700 600 500 400 300 200 100 0 2 4 6 Time (ns) 8 10 0 1.3 2.6 3.9 5.1 6.4 RMSD (Å) Figure S35. a) Trajectory of the dynamics of mAGi8 with Li+(yellow) using the structure with K+ (orange) as a reference; b) distribution of the corresponding RMSD values from a. S34 Supporting information Martín-Hidalgo M. et al. a. Figure S36. Supramolecular structure for mAGi8•Li+ b. 700 700 600 600 500 500 Count Count a. 400 300 400 300 200 200 100 100 0 0 0 1.3 2.6 3.9 RMSD (Å) 5.1 6.4 0 1.3 2.6 3.9 5.1 6.4 RMSD (Å) Figure S37. Histogram plots of the distribution of the root mean square displacements of mAGi8 a) K+ (orange) and b) Li+ (yellow). The color code and labels are the same as in the main text. S35
