Part VII: National child death statistics:
advertisement
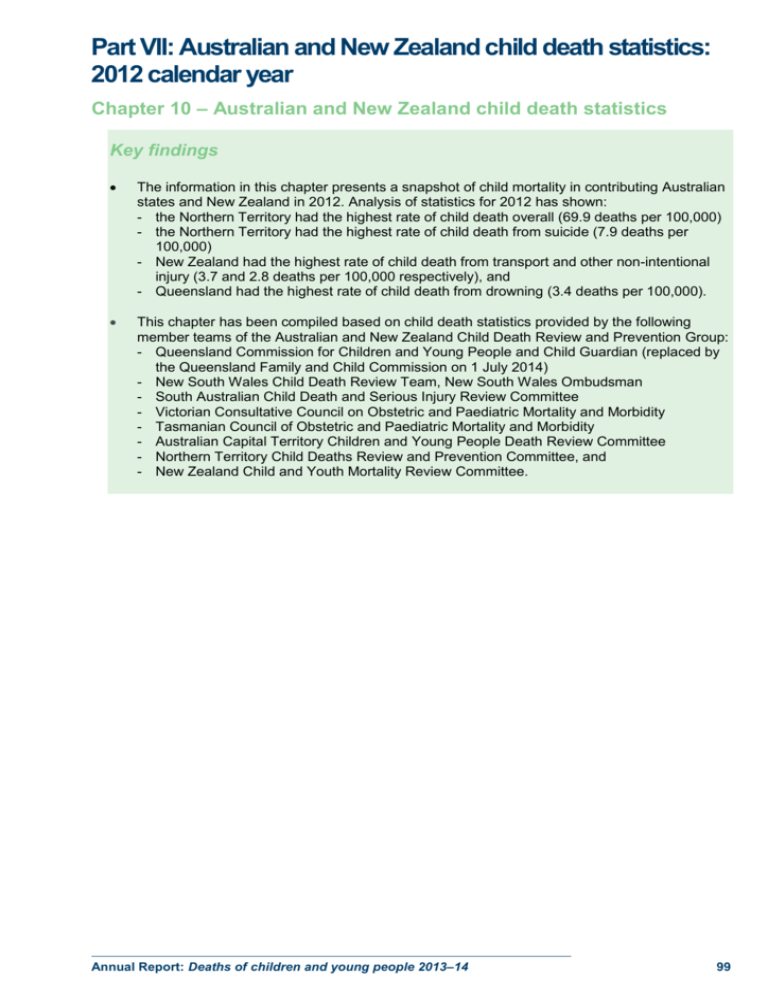
Part VII: Australian and New Zealand child death statistics: 2012 calendar year Chapter 10 – Australian and New Zealand child death statistics Key findings The information in this chapter presents a snapshot of child mortality in contributing Australian states and New Zealand in 2012. Analysis of statistics for 2012 has shown: - the Northern Territory had the highest rate of child death overall (69.9 deaths per 100,000) - the Northern Territory had the highest rate of child death from suicide (7.9 deaths per 100,000) - New Zealand had the highest rate of child death from transport and other non-intentional injury (3.7 and 2.8 deaths per 100,000 respectively), and - Queensland had the highest rate of child death from drowning (3.4 deaths per 100,000). This chapter has been compiled based on child death statistics provided by the following member teams of the Australian and New Zealand Child Death Review and Prevention Group: - Queensland Commission for Children and Young People and Child Guardian (replaced by the Queensland Family and Child Commission on 1 July 2014) - New South Wales Child Death Review Team, New South Wales Ombudsman - South Australian Child Death and Serious Injury Review Committee - Victorian Consultative Council on Obstetric and Paediatric Mortality and Morbidity - Tasmanian Council of Obstetric and Paediatric Mortality and Morbidity - Australian Capital Territory Children and Young People Death Review Committee - Northern Territory Child Deaths Review and Prevention Committee, and - New Zealand Child and Youth Mortality Review Committee. Annual Report: Deaths of children and young people 2013–14 99 Australian and New Zealand child death statistics In recognition of the need to develop nationally comparable data and multi-jurisdiction prevention messages, agencies with child death review functions have convened the Australian and New Zealand Child Death Review and Prevention Group (ANZCDR&PG). The stated aim of the ANZCDR&PG is to identify, address and potentially decrease the numbers of infant, child and youth deaths by sharing information on issues in the review and reporting of child deaths and to work collaboratively towards national and international reporting. Child death review functions within agencies throughout Australia and New Zealand are at varying stages of implementation and have individual legislative bases, functions, roles and reporting requirements. The data prepared by these agencies currently differs in some respects, but meaningful comparisons are still achievable. The jurisdictions currently with the capacity to share detailed child death data are Queensland, New South Wales, Victoria, South Australia, Tasmania, Australian Capital Territory, Northern Territory and New Zealand. Western Australia is continuing to build their data collection and reporting capacity, it is hoped that this dataset will be included with child death data from all Australian states and territories in the next reporting period. The methodology used in compiling the data in this chapter is outlined in Appendix 10.1. 100 Queensland Family and Child Commission All causes of child deaths: 2012 Table 10.1: Number and rate of child deaths by age and jurisdiction, 2012 Age category Jurisdiction Under 1 1–4 5–9 10–14 year years years years QLD NSW SA VIC TAS ACT NT NZ n 276 55 28 32 15–17 years 48 Rate per 100,000 436.5 22.2 9.3 10.8 26.4 40.5 n 310 51 45 36 67 509 Rate per 100,000 315.7 13.4 9.9 8.1 24.4 30.7 n 63 12 10 8 13 106 Rate per 100,000 311.9 15.2 10.4 8.2 20.9 29.8 n 226 56 32 37 55 406 Rate per 100,000 302.6 19.6 9.4 11.2 26.4 32.9 n 25 3 1 5 6 40 Rate per 100,000 396.3 * * 15.4 29.2 34.5 n 12 <5a <5a <5a <5a 20 Rate per 100,000 227.4 - - - - 24.4 n 22 6 4 4 8 44 Rate per 100,000 554.4 40.5 22.6 23.8 82.2 69.9 n 276 63 30 46 92 507 Rate per 100,000 446.8 24.7 10.3 15.3 49.3 46.2 Total 439 Data source: Australian and New Zealand Child Death Review and Prevention Group (2012) * Rates have not been calculated for numbers less than 4. a Figure not specified where number of deaths is less than 5. Notes: 1. Rates are calculated per 100,000 children in each age category in each jurisdiction. 2. Total rates are calculated per 100,000 children aged 0–17 years in each jurisdiction. 3. Australian Capital Territory data was not available in some age categories age due to the potential identification of individual cases. 4. Australian Capital Territory data does not include deaths of children and young people awaiting coroner’s findings. 5. Victorian data in this table are provisional and subject to change. Full data will be available from the upcoming Annual Report for the Year 2012 at www.health.vic.gov.au/ccopmm/index.htm. 6. Note that caution must be exercised when comparing rates between jurisdictions. Although the rates are based on a population rather than a sample, common practice is to consider death a random event, and hence have an associated sampling error. This is particularly important when comparing rates from low numbers. Current methodology calculates the crude rates for 2012, and should not be used to infer the general probability of death for specific cohorts. Children in the under 1 year age category had the highest number of child deaths in all jurisdictions. In general, the rate of death in childhood usually decreases with increasing age until the teen years, when it increases again. In all jurisdictions, rates of death (where calculable) are second highest in the 15–17 year age category. Annual Report: Deaths of children and young people 2013–14 101 Table 10.2 below shows the number and rate of child deaths in each jurisdiction by sex. Males experienced higher rates of death in all but one jurisdiction. Table 10.2: Number and rate of child deaths by sex and jurisdiction, 2012 Sex Jurisdiction Female QLD NSW SA VIC TAS ACT NT NZ Male n 190 249 Rate per 100,000 35.8 44.5 n 205 304 Rate per 100,000 25.5 35.7 n 49 57 Rate per 100,000 28.2 31.3 n 193 212 Rate per 100,000 32.0 33.3 n 14 26 Rate per 100,000 25.1 43.3 n 12 8 Rate per 100,000 30.1 18.9 n 21 23 Rate per 100,000 69.4 70.3 n 208 295 Rate per 100,000 38.9 52.5 Data source: Australian and New Zealand Child Death Review and Prevention Group (2012) Notes: 1. Rates are calculated per 100,000 females and per 100,000 males aged 0–17 years in each jurisdiction. 2. There was one child death in Victoria and four child deaths in New Zealand where the sex was either unknown or undetermined. 3. Victorian data in this table are provisional and subject to change. Full data will be available from the upcoming Annual Report for the Year 2012 at www.health.vic.gov.au/ccopmm/index.htm. 4. Note that caution must be exercised when comparing rates between jurisdictions. Although the rates are based on a population rather than a sample, common practice is to consider death a random event, and hence have an associated sampling error. This is particularly important when comparing rates from low numbers. Current methodology calculates the crude rates for 2012, and should not be used to infer the general probability of death for specific cohorts. Diseases and morbid conditions – excluding SIDS and undetermined causes Deaths from diseases and morbid conditions are those deaths whose underlying cause is an infection, disease, congenital anomaly or other naturally-occurring condition. As outlined in Table 10.3 below, deaths from diseases and morbid conditions were highest for infants under 1 year of age in all jurisdictions. The Northern Territory had the highest rate of child deaths from diseases and morbid conditions (28.6 per 100,000), followed by Tasmania (28.5 per 100,000). 102 Queensland Family and Child Commission Table 10.3: Number and rate of child deaths from diseases and morbid conditions by age and jurisdiction, 2012 Age category Jurisdiction Under 1 10–14 15–17 1–4 years 5–9 years year years years QLD NSW SA VIC TAS ACT NT NZ Total n 227 30 20 16 16 309 Rate per 100,000 359.0 12.1 6.6 5.4 8.8 28.3 n 267 32 31 21 25 376 Rate per 100,000 271.9 8.4 6.8 4.7 9.1 22.7 n 58 5 7 5 <4a 78 Rate per 100,000 287.1 6.3 7.3 5.1 * 21.9 n 204 34 18 30 18 304 Rate per 100,000 273.1 11.9 5.3 9.1 8.7 24.5 n 22 3 1 2 5 33 Rate per 100,000 348.7 * * * 24.3 28.5 n - - - - - 17 Rate per 100,000 * * * * * 20.7 n 11 2 2 1 2 18 Rate per 100,000 277.2 * * * * 28.6 n 186 46 19 22 27 300 Rate per 100,000 301.1 18.0 6.5 7.3 14.5 27.3 Data source: Australian and New Zealand Child Death Review and Prevention Group (2012) a Figure not specified where number of deaths is less than 4. * Rates have not been calculated for numbers less than 4. Notes: 1. Rates are calculated per 100,000 children in each age category in each jurisdiction. 2. Total rates are calculated per 100,000 children aged 0–17 years in each jurisdiction. 3 Australian Capital Territory data were not available for age categories due to the potential identification of individual cases. 4. Victorian data in this table are provisional and subject to change. Full data will be available from the upcoming Annual Report for the Year 2012 at www.health.vic.gov.au/ccopmm/index.htm. 5. The cause of 44 deaths in New Zealand, 3 deaths in the Northern Territory and 1 death in Queensland are yet to be finalised and are not counted in Tables 10.3, 10.4 or 10.5. Hence the overall numbers and rates are subject to change. 6. Note that caution must be exercised when comparing rates between jurisdictions. Although the rates are based on a population rather than a sample, common practice is to consider death a random event, and hence have an associated sampling error. This is particularly important when comparing rates from low numbers. Current methodology calculates the crude rates for 2012, and should not be used to infer the general probability of death for specific cohorts. External causes External cause deaths are those resulting from environmental events and circumstances causing injury, poisoning and other adverse effects. Table 10.4 illustrates the number and rate of child deaths from external causes across seven jurisdictions. Deaths from external causes occurred at a higher rate in the Northern Territory than in any other jurisdiction (22.2 per 100,000). New Zealand had the next highest rate of death from external causes, at 12.0 per 100,000. New Zealand had the greatest rate of transport deaths (3.6 per 100,000) followed by Queensland (3.4 per 100,000). Drowning deaths occurred at the greatest rate in Queensland (1.3 per 100,000), whilst the rate of suicide deaths was highest in the Northern Territory (7.9 per 100,000). Annual Report: Deaths of children and young people 2013–14 103 Table 10.4: Number and rate of child deaths from external causes by jurisdiction, 2012 Cause of death Other nonFatal Jurisdiction intentional assault Transport Drowning Suicide injury related and death neglect n 37 14 13 16 8 QLD Rate per 100,000 3.4 1.3 1.2 1.5 0.7 NSW SA VIC TAS ACT NT NZ Total 88 8.1 n 37 13 17 19 3 89 Rate per 100,000 2.2 0.8 1.0 1.1 * 5.4 n 9 <4a <4a 5 <4a 21 Rate per 100,000 2.5 * * 1.4 * 5.9 72 n 18 <10b 16 25 <10b Rate per 100,000 1.5 * 1.3 2.0 * 5.8 n 2 0 1 1 1 5 Rate per 100,000 * 0.0 * * * 4.3 n - - - - - <5c Rate per 100,000 * * * * * * n 3 2 2 5 2 14 Rate per 100,000 * * * 7.9 * 22.2 n 40 10 30 46 6 132 Rate per 100,000 3.6 0.9 2.7 4.2 0.5 12.0 Data source: Australian and New Zealand Child Death Review and Prevention Group (2012) * Rates have not been calculated for numbers less than 4 or less than 10 for Victorian data. a Figure not specified where number of deaths is less than 4. b Figure not specified where number of deaths is less than 10. c Figure not specified where number of deaths is less than 5. Notes: 1. Classification of external cause deaths may differ from state to state. The methodology section in Appendix 10.1 provides further details. 2. Rates are calculated per 100,000 children aged 0–17 years in each jurisdiction. 3. Australian Capital Territory data were not available due to the potential identification of individual cases. 4. Victorian data in this table are provisional and subject to change. Full data will be available from the upcoming Annual Report for the Year 2012 at www.health.vic.gov.au/ccopmm/index.htm. 5. The cause of 44 deaths in New Zealand, 3 deaths in the Northern Territory and 1 death in Queensland are yet to be finalised and are not counted in Tables 10.3, 10.4 or 10.5. Hence the overall numbers and rates are subject to change. 6. Note that caution must be exercised when comparing rates between jurisdictions. Although the rates are based on a population rather than a sample, common practice is to consider death a random event, and hence have an associated sampling error. This is particularly important when comparing rates from low numbers. Current methodology calculates the crude rates for 2012, and should not be used to infer the general probability of death for specific cohorts. Deaths from ill-defined and unknown causes of mortality The deaths of children as a result of unknown or ill-defined causes of mortality, including Sudden Infant Death Syndrome (SIDS) are outlined in Table 10.5 below. Unexplained deaths of infants Of specific interest in the study of infant deaths are those certified as due to SIDS or where the cause of death cannot be determined. SIDS is defined as the sudden, unexpected death of an infant under 1 year of age, the cause of which remains unexplained after a thorough investigation (including review of the death scene, clinical history and complete autopsy). While SIDS is, essentially, an undetermined cause of death itself, infant deaths should be specifically certified as ‘undetermined’ when: • • • • natural disease processes were detected (insufficient to cause death but precluding a SIDS diagnosis) there are signs of significant stress non-accidental but non-lethal injuries were present, or toxicology screening detects non-prescribed but non-lethal drugs. The Northern Territory recorded the highest rate of unexplained infant deaths (226.8 per 100,000 infants) followed by Queensland (63.3 per 100,000). 104 Queensland Family and Child Commission Undetermined deaths of children over the age of 1 year There are also cases where a cause of death is unable to be determined for children over the age of 1 year. These deaths may occur in any age category, but are most often of children in the 1–4 year age category. The circumstances of these deaths often resemble those of infants, but are precluded from a diagnosis of SIDS as they are over the age of 1. Table 10.5: Child deaths from SIDS and undetermined causes by age and jurisdiction, 2012 Age category 1–17 Jurisdiction Under 1 1–4 5–9 10–14 15–17 years year years years years years total n 40 1 0 0 0 1 QLD Rate per 100,000 63.3 * 0.0 * 0.0 * NSW SA VIC TAS ACT NT NZ n 36 7 0 Rate per 100,000 36.7 1.8 0.0 n 4 Rate per 100,000 19.8 0 1 0.0 * <4a Total 41 3.8 8 44 0.5 2.7 <4a 7 * * * * * 2.0 <10b <10b 15 30 * * 1.3 2.4 n 15 10 <10b Rate per 100,000 20.1 3.5 * n 2 0 0 0 0 0 2 Rate per 100,000 * 0.0 0.0 0.0 0.0 0.0 * n - - - - - - <5c Rate per 100,000 * * * * * * * n 9 0 0 0 0 0 9 Rate per 100,000 226.8 0.0 0.0 0.0 0.0 0.0 14.3 n 24 <3d <3d <3d 5 7 31 Rate per 100,000 38.9 * * * 2.7 0.7 2.8 Data source: Australian and New Zealand Child Death Review and Prevention Group (2012) * Rates have not been calculated for numbers less than 4, or less than 10 for Victorian data. a Figure not specified where number of deaths is less than 4. b Figure not specified where the number of deaths is less than 10. c Figure not specified where the number of deaths is less than 5. d Figure not specified where the number of deaths is less than 3. Notes: 1. Classification of external cause deaths may differ from state to state. The methodology section in Appendix 10.1 provides further details. 2 Rates are calculated per 100,000 children aged 0–17 years in each jurisdiction. 3 Australian Capital Territory data was not available due to the potential identification of individual cases. 4 Victorian data in this table are provisional and subject to change. Full data will be available from the upcoming Annual Report for the Year 2012 at www.health.vic.gov.au/ccopmm/index.htm. 5 The cause of 44 deaths in New Zealand, 3 deaths in the Northern Territory and 1 death in Queensland are yet to be finalised and are not counted in Tables 10.3, 10.4 or 10.5. Hence the overall numbers and rates are subject to change. 6 Note that caution must be exercised when comparing rates between jurisdictions. Although the rates are based on a population rather than a sample, common practice is to consider death a random event, and hence have an associated sampling error. This is particularly important when comparing rates from low numbers. Current methodology calculates the crude rates for 2012, and should not be used to infer the general probability of death for specific cohorts. Annual Report: Deaths of children and young people 2013–14 105 Deaths of Indigenous children and young people Table 10:6: Number and rate of Indigenous child deaths by year of death and jurisdiction, 2008–201276 Year Jurisdiction 2008 2009 2010 2011 2012 QLD NSW SA VIC TAS ACT NT NZ n 62 64 62 63 55 Rate per 100,000 77.9 78.9 75.1 75.4 64.9 n 46 31 56 55 46 Rate per 100,000 52.0 34.7 62.2 60.8 50.6 n 11 11 8 12 13 Rate per 100,000 74.0 73.1 52.5 77.3 83.0 n 12 <10a <10a <10a <10a Rate per 100,000 62.6 * * * * n 0 0 0 0 0 Rate per 100,000 0.0 0.0 0.0 0.0 0.0 n <5b <5b <5b <5b 0 Rate per 100,000 * * * * 0.0 n 36 32 27 50 35 Rate per 100,000 133.0 118.6 100.6 187.6 131.2 n 207 240 224 203 194 Rate per 100,000 78.9 90.5 83.5 74.8 70.9 Data source: Australian and New Zealand Child Death Review and Prevention Group (2012) * Rates have not been calculated for numbers less than 10 for Victorian data and less than 5 for Australian Capital Territory data. a Figure not specified where number of deaths is less than 10. b Figure not specified where number of deaths is less than 5. Notes: 1. Rates are calculated per 100,000 Indigenous children aged 0–17 years in each jurisdiction. 2. Victorian data in this table are provisional and subject to change. Full data will be available from the upcoming Annual Report for the Year 2012 at www.health.vic.gov.au/ccopmm/index.htm. 3. Note that caution must be exercised when comparing rates between jurisdictions. Although the rates are based on a population rather than a sample, common practice is to consider death a random event, and hence have an associated sampling error. This is particularly important when comparing rates from low numbers. Current methodology calculates the crude rates for 2012, and should not be used to infer the general probability of death for specific cohorts. It should be noted that some jurisdictions experience difficulty with the collection of data regarding Aboriginal and Torres Strait Islander status. Challenges are also faced in obtaining accurate population data for Indigenous children and young people in Australia to enable the calculation of rates. Therefore, the rates presented in Table 10.6 should be interpreted with caution. Rates of Aboriginal and Torres Strait Islander child deaths (Australia) and Mãori child deaths (New Zealand) from 2008 to 2012 have also been included in Table 10.6. Based on the available data, in 2012 the Northern Territory had the highest rate of death for Aboriginal and Torres Strait Islander children and young people (131.2 per 100,000), followed by South Australia (83.0 per 100,000). The New Zealand rate of deaths for Mãori children was 70.9 per 100,000. 76 Note that for Australian jurisdictions, Indigenous children refers to the Aboriginal and Torres Strait Islander population, whilst Zealand it refers to the Māori population. 106 for New Queensland Family and Child Commission Selected findings for contributing Australian states and territories and New Zealand in 2012 are provided in Figure 10.1 below. Apparent from this illustration is the relative homogeneity of child death rates from diseases and morbid conditions, but the considerable variation in rates where the underlying numbers of deaths are relatively small (such as for deaths from SIDS and undetermined causes). As noted above, problems in the collection of Indigenous status data on death registrations may result in an undercount in the Indigenous death rates, limiting the comparability of the data on this aspect. 250 QLD NSW SA VIC TAS ACT NT NZ 226.8 Figure 10.1: Jurisdictional comparisons – selected findings, 2012 131.2 0 0 70.9 0 0 0 38.9 63.3 36.7 19.8 20.1 8.1 5.4 5.9 5.8 4.3 0 22.2 12 28.3 22.7 21.9 24.5 28.5 20.7 28.6 27.3 46.2 50 69.9 100 64.9 50.6 83.0 150 40.5 30.7 29.8 32.9 34.5 24.4 Rate per 100,000 200 0 Total deaths (0–17 years) Diseases and morbid conditions External causes SIDS and undetermined causes (infants) Indigenous deaths Jurisdiction Data source: Australian and New Zealand Child Death Review and Prevention Group (2012) * Rates have not been calculated for numbers less than 4, numbers less than 10 for Victorian data and less than 5 for Australian Capital Territory data. Note: 1 Victorian data in this figure are provisional and subject to change. Full data will be available from the upcoming Annual Report for the Year 2012 at www.health.vic.gov.au/ccopmm/index.htm 2 Note that caution must be exercised when comparing rates between jurisdictions. Although the rates are based on a population rather than a sample, common practice is to consider death a random event, and hence have an associated sampling error. This is particularly important when comparing rates from low numbers. Current methodology calculates the crude rates for 2012, and should not be used to infer the general probability of death for specific cohorts. Annual Report: Deaths of children and young people 2013–14 107 This page has been intentionally left blank. 108 Queensland Family and Child Commission

