Foundation Level Two Tier GCSE Mathematics
advertisement
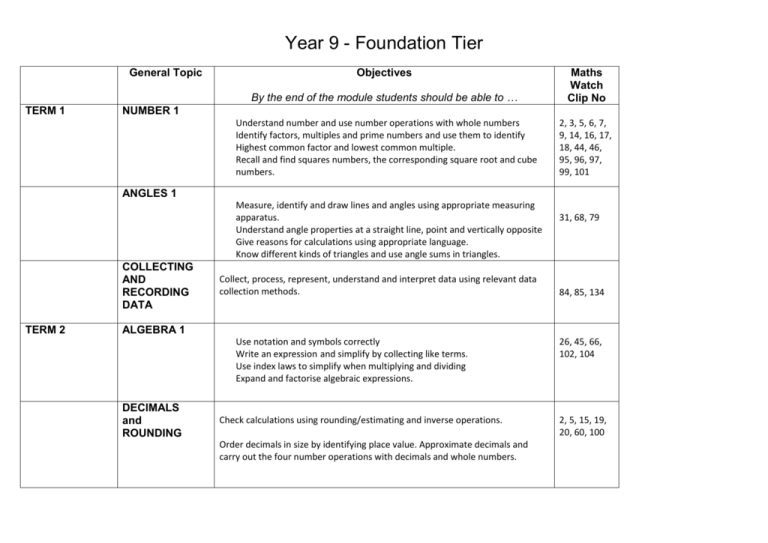
Year 9 - Foundation Tier General Topic TERM 1 Objectives By the end of the module students should be able to … Maths Watch Clip No Understand number and use number operations with whole numbers Identify factors, multiples and prime numbers and use them to identify Highest common factor and lowest common multiple. Recall and find squares numbers, the corresponding square root and cube numbers. 2, 3, 5, 6, 7, 9, 14, 16, 17, 18, 44, 46, 95, 96, 97, 99, 101 NUMBER 1 ANGLES 1 Measure, identify and draw lines and angles using appropriate measuring apparatus. Understand angle properties at a straight line, point and vertically opposite Give reasons for calculations using appropriate language. Know different kinds of triangles and use angle sums in triangles. COLLECTING AND RECORDING DATA TERM 2 Collect, process, represent, understand and interpret data using relevant data collection methods. 31, 68, 79 84, 85, 134 ALGEBRA 1 Use notation and symbols correctly Write an expression and simplify by collecting like terms. Use index laws to simplify when multiplying and dividing Expand and factorise algebraic expressions. DECIMALS and ROUNDING Check calculations using rounding/estimating and inverse operations. Order decimals in size by identifying place value. Approximate decimals and carry out the four number operations with decimals and whole numbers. 26, 45, 66, 102, 104 2, 5, 15, 19, 20, 60, 100 Foundation Tier General Topic Objectives By the end of the module students should be able to … TWO DIMENSIONAL SHAPE Construct, reflect, rotate and use symmetry with 2D shapes including triangles, quadrilaterals and circles. Recognise and identify of 2D shapes. Understand and identify congruency and similarity Maths Watch Clip No 32, 36, 80, 123, 127, 128, 129 Foundation Tier General Topic Objectives By the end of the module students should be able to … Maths Watch Clip No ANGLES 2 Mark perpendicular and parallel lines on a diagram. Use angle properties on parallel lines. Understand the proof that the angle sum of a triangle is 180° Understand a proof that the exterior angle of a triangle is equal to the sum of the interior angles at the other two vertices Make an accurate scale drawing from a diagram Understand and use the angle properties of quadrilaterals Use the fact that angle sum of a quadrilateral is 360º Give reasons for angle calculations Use three figure-bearings to specify direction Mark on a diagram the position of point B given its bearing from the point A 36 68/69 67 36 68 Give a bearing between the points on a map or scaled plan Given the bearing of point A from point B, work out the bearing of B from A Interpret map/model scales as a ratio Calculate and use the sums of the interior angles of polygons Use geometrical language appropriately and recognise and name pentagons, hexagons, heptagons, octagons and decagons Know, or work out, the relationship between the number of sides of a polygon and the sum of its interior angles 131 70 Foundation Tier General Topic Objectives By the end of the module students should be able to … Know that the sum of the exterior angles of any polygon is 360° Calculate the size of each exterior/interior angle of a regular polygon Understand tessellations of regular and irregular polygons Tessellate combinations of polygons Explain why some shapes tessellate and why other shapes do not TERM 3 Maths Watch Clip No 38 FRACTIONS 1 Visualise a fraction diagrammatically Understand a fraction as part of a whole Recognise and write fractions in everyday situations Find fractions of amounts Write a fraction in its simplest form and recognise equivalent fractions Compare the sizes of fractions using a common denominator Add and subtract fractions by using a common denominator Write an improper fraction as a mixed fraction Convert between fractions and decimals Multiplying Fractions Dividing Fractions ALGEBRA 2 Use brackets and the hierarchy of operations (BIDMAS): Use index notation for squares and cubes Use index notation for powers of 10 Find the value of calculations using indices 12/56 57 8/55 47/48 13/49 56 56 10/13/58 57/47 59 111 Foundation Tier General Topic Objectives By the end of the module students should be able to … USING A CALCULATOR Understand ‘reciprocal’ as multiplicative inverse, knowing that any nonzero number multiplied by its reciprocal is 1 (and that zero has no reciprocal because division by zero is undefined): Convert between fractions and decimals Maths Watch Clip No Foundation Tier General Topic Objectives By the end of the module students should be able to … TERM 4 MEASURE Maths Watch Clip No Interpret scales on a range of measuring instruments inc mm, cm, m, 4 km, ml, cl, l, mg, g, kg, tonnes, °C Indicate given values on a scale 64 Know that measurements using real numbers depend upon the choice of unit Recognise that measurements given to the nearest whole unit may be inaccurate by up to one half in either direction Convert units within one system Convert metric units to metric units (Metric equivalents should be known) Convert imperial units to imperial units (NB: Conversion between imperial units will be given) Convert between metric and imperial measures Know rough metric equivalents of pounds, feet, miles, pints and gallons, ie Metric Imperial 1 kg = 2.2 pounds 1.75 pints = 1 litre 4.5 l = 1 gallon 8 km = 5 miles 30 cm = 1 foot Estimate conversions Use the relationship between distance, speed and time to solve 126 problems Convert between metric units of speed, eg km/h to m/s Convert between 12–hour and 24–hour hour clock times Read bus and train timetables and plan journeys 24/25 Foundation Tier General Topic Objectives By the end of the module students should be able to … PROCESSING, REPRESENTING AND INTERPRETING DATA Draw: o Pictograms o Composite bar charts o Comparative and dual bar charts o Frequency polygons, o Histograms with equal class intervals o Frequency diagrams for grouped discrete data o Line graphs Interpret: o composite bar charts o comparative and dual bar charts o stem and leaf diagrams o scatter graphs o frequency polygons From pictograms, bar charts, line graphs and histograms with equal class intervals: o read off frequency values o calculate total population o find greatest and least values Recognise simple patterns and characteristic relationships in bar charts, line graphs and frequency polygons Use dual or comparative bar charts to compare distributions Represent data in a pie chart Interpret data in a pie chart Understand that the frequency represented by corresponding sectors in two pie charts is dependent upon the total populations represented by each of the pie charts From pie charts o find the total frequency o find the size of each category Maths Watch Clip No 42 88/85 27 89 87 86 Foundation Tier General Topic Objectives By the end of the module students should be able to … SEQUENCES PERIMETER AND AREA OF 2D SHAPE Maths Watch Clip No Generate simple sequences of odd or even numbers Find the missing numbers in a number pattern or sequence Find the nth term of a number sequence Use the nth number of an arithmetic sequence Find whether a number is part of a given sequence Continue a sequence derived from diagrams Use a calculator to produce a sequence of numbers Measure shapes to find perimeters and areas Find the perimeter of rectangles and triangles 33/73 Find the perimeter of compound shapes Find the area of a rectangle and triangle Recall and use the formulae for the area of a triangle, rectangle and a parallelogram Calculate areas of compound shapes made from triangles and rectangles 121 Find the area of a trapezium by using the formula Solve a range of problems involving areas including cost of carpet type questions 35 29/30 65/112 Foundation Tier General Topic Objectives By the end of the module students should be able to … TERM 5 GRAPHS 1 Use axes and coordinates to specify points in all four quadrants in 2-D: Identify points with given coordinates: Identify coordinates of given points (NB: Points may be in the first quadrant Maths Watch Clip No 28 120 78 or all four quadrants): Find the coordinates of points identified by geometrical information in 2-D: Find the coordinates of the midpoint of a line segment, AB, given the AVERAGES AND RANGE coordinates of A and B: Draw, label and put suitable scales on axes Recognise that equations of the form y = mx + c correspond to straightline graphs in the coordinate plane Plot and draw graphs of functions Plot and draw graphs of straight lines of the form y = mx + c Find the gradient of a straight line from a graph Calculate the mean, mode, median and range for discrete data Calculate the mean, mode, median and range from an ordered stem and leaf diagram Produce an ordered stem and leaf diagram Calculate the modal class and interval containing the median for continuous data Calculate the mean, median and mode from a frequency table Estimate the mean of grouped data using the mid-interval value Compare the mean and range of two distributions Recognise the advantages and disadvantages between measures of average Calculate the mean of a small data set, using the appropriate key on a scientific calculator 43 117 113/114 41 133 Foundation Tier General Topic Objectives By the end of the module students should be able to … CIRCLES Draw: o o o o o o o Pictograms Composite bar charts Comparative and dual bar charts Frequency polygons, Histograms with equal class intervals Frequency diagrams for grouped discrete data Line graphs Interpret: o composite bar charts o comparative and dual bar charts o stem and leaf diagrams o scatter graphs o frequency polygons Find circumferences of circles and areas enclosed by circles Recall and use the formulae for the circumference of a circle and the area enclosed by a circle Use π ≈ 3.142 or use the π button on a calculator Find the perimeters and areas of semicircles and quarter circles Maths Watch Clip No 71/72 Foundation Tier General Topic Objectives By the end of the module students should be able to … TERM 6 CONSTRUCTIO N AND LOCI Draw and construct diagrams from given instructions – A region bounded by a circle and an intersecting line – A given distance from a point and a given distance from a line – Equal distances from 2 points or 2 line segments – Regions which may be defined by ‘nearer to’ or ‘greater than’ – Find and describe regions satisfying a combination of loci Maths Watch Clip No 130
