Categorical Question
advertisement
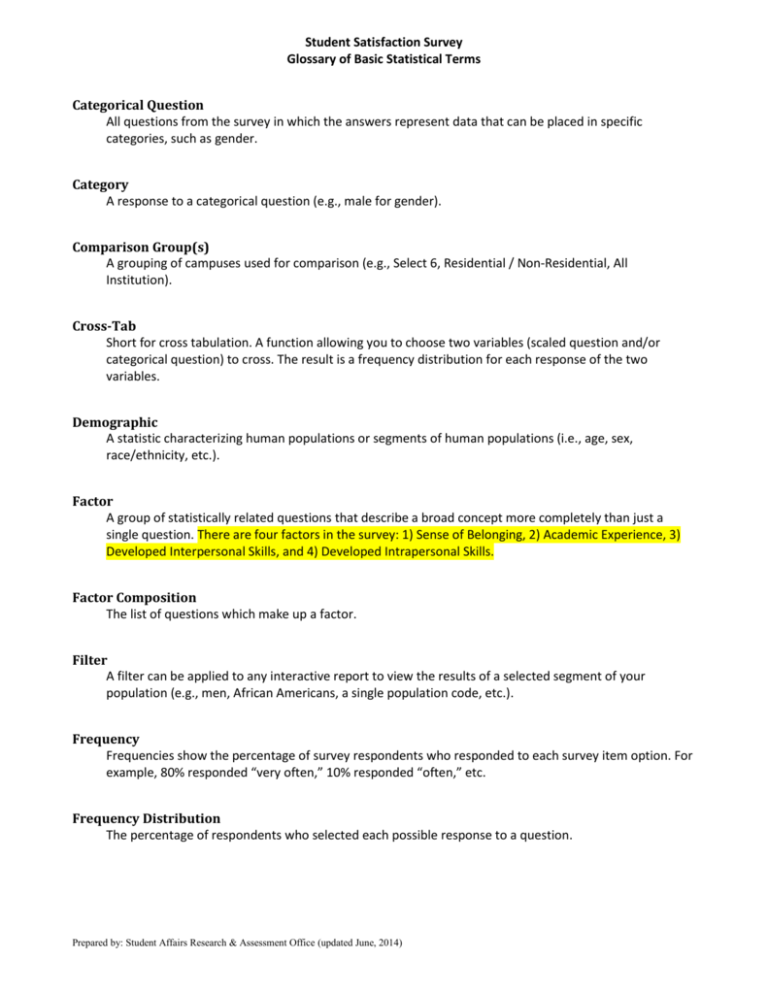
Student Satisfaction Survey Glossary of Basic Statistical Terms Categorical Question All questions from the survey in which the answers represent data that can be placed in specific categories, such as gender. Category A response to a categorical question (e.g., male for gender). Comparison Group(s) A grouping of campuses used for comparison (e.g., Select 6, Residential / Non-Residential, All Institution). Cross-Tab Short for cross tabulation. A function allowing you to choose two variables (scaled question and/or categorical question) to cross. The result is a frequency distribution for each response of the two variables. Demographic A statistic characterizing human populations or segments of human populations (i.e., age, sex, race/ethnicity, etc.). Factor A group of statistically related questions that describe a broad concept more completely than just a single question. There are four factors in the survey: 1) Sense of Belonging, 2) Academic Experience, 3) Developed Interpersonal Skills, and 4) Developed Intrapersonal Skills. Factor Composition The list of questions which make up a factor. Filter A filter can be applied to any interactive report to view the results of a selected segment of your population (e.g., men, African Americans, a single population code, etc.). Frequency Frequencies show the percentage of survey respondents who responded to each survey item option. For example, 80% responded “very often,” 10% responded “often,” etc. Frequency Distribution The percentage of respondents who selected each possible response to a question. Prepared by: Student Affairs Research & Assessment Office (updated June, 2014) Campus Specific Question (CSQ) Questions submitted by your campus that pertain specifically to your campus (not applicable to University Park colleges). Likert Response Scale The most widely used scale in survey research, it is used as a measurement of the degree to which people agree or disagree with a statement. This survey uses a five point scale. Mean The arithmetic average. The value obtained by dividing the sum of a set of responses to a question by the number of responses to that question. N The total number of respondents, which will vary from question to question. Open-ended Questions A question-type which allows respondents to reply in text form, rather than selecting a pre-set answer from a list. Campuses may have included an open-ended question in their campus specific questions. Percent Responding The percentage of participants who responded. Printable Survey The online survey in a printable format. Reliability The consistency of the respondents' answers to the scaled questions which compose a factor. Response Key A set of answers to a scaled question. Example: Very dissatisfied, Somewhat dissatisfied, Neither dissatisfied or satisfied, Somewhat satisfied, Very satisfied. Response Rate The number of participants who completed the assessment divided by the total number of survey participants. Scaled Questions All questions from the survey which were answered using a Likert response scale (i.e., Very dissatisfied to Very satisfied) Select 6 Up to six other campuses, chosen by your campus, to form a comparison group (not applicable to University Park). Prepared by: Student Affairs Research & Assessment Office (updated June, 2014) Standard Deviation A measure of dispersal, or variation, in a group of numbers. Large standard deviations imply little commonality of responses among respondents. Small standard deviations imply a high level of consistency of responses among respondents. Statistical Significance A relationship is statistically significant if it is unlikely to have occurred by chance. Levels of significance are reported as p-values. Commonly, a p-value ≤ .05 is considered significant. Statistical Testing of Means Detecting the existence of a true difference between the means of two populations. Means that do not show a statistical difference are assumed to be equal. A t-test is used to determine if the difference between two means is statistically significant. WESS Web Enabled Survey System Prepared by: Student Affairs Research & Assessment Office (updated June, 2014)

