fwb12581-sup-0001-TableS1-S3
advertisement
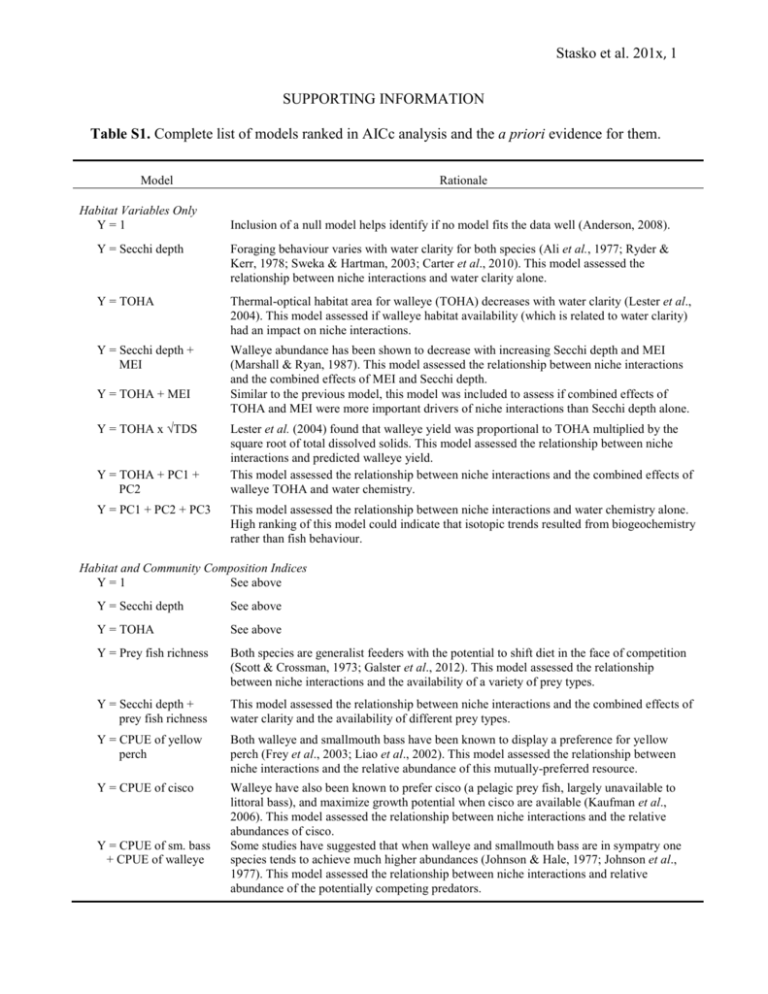
Stasko et al. 201x, 1 SUPPORTING INFORMATION Table S1. Complete list of models ranked in AICc analysis and the a priori evidence for them. Model Habitat Variables Only Y=1 Rationale Inclusion of a null model helps identify if no model fits the data well (Anderson, 2008). Y = Secchi depth Foraging behaviour varies with water clarity for both species (Ali et al., 1977; Ryder & Kerr, 1978; Sweka & Hartman, 2003; Carter et al., 2010). This model assessed the relationship between niche interactions and water clarity alone. Y = TOHA Thermal-optical habitat area for walleye (TOHA) decreases with water clarity (Lester et al., 2004). This model assessed if walleye habitat availability (which is related to water clarity) had an impact on niche interactions. Y = Secchi depth + MEI Walleye abundance has been shown to decrease with increasing Secchi depth and MEI (Marshall & Ryan, 1987). This model assessed the relationship between niche interactions and the combined effects of MEI and Secchi depth. Similar to the previous model, this model was included to assess if combined effects of TOHA and MEI were more important drivers of niche interactions than Secchi depth alone. Y = TOHA + MEI Y = TOHA x √TDS Y = TOHA + PC1 + PC2 Y = PC1 + PC2 + PC3 Lester et al. (2004) found that walleye yield was proportional to TOHA multiplied by the square root of total dissolved solids. This model assessed the relationship between niche interactions and predicted walleye yield. This model assessed the relationship between niche interactions and the combined effects of walleye TOHA and water chemistry. This model assessed the relationship between niche interactions and water chemistry alone. High ranking of this model could indicate that isotopic trends resulted from biogeochemistry rather than fish behaviour. Habitat and Community Composition Indices Y=1 See above Y = Secchi depth See above Y = TOHA See above Y = Prey fish richness Both species are generalist feeders with the potential to shift diet in the face of competition (Scott & Crossman, 1973; Galster et al., 2012). This model assessed the relationship between niche interactions and the availability of a variety of prey types. Y = Secchi depth + prey fish richness This model assessed the relationship between niche interactions and the combined effects of water clarity and the availability of different prey types. Y = CPUE of yellow perch Both walleye and smallmouth bass have been known to display a preference for yellow perch (Frey et al., 2003; Liao et al., 2002). This model assessed the relationship between niche interactions and the relative abundance of this mutually-preferred resource. Y = CPUE of cisco Walleye have also been known to prefer cisco (a pelagic prey fish, largely unavailable to littoral bass), and maximize growth potential when cisco are available (Kaufman et al., 2006). This model assessed the relationship between niche interactions and the relative abundances of cisco. Some studies have suggested that when walleye and smallmouth bass are in sympatry one species tends to achieve much higher abundances (Johnson & Hale, 1977; Johnson et al., 1977). This model assessed the relationship between niche interactions and relative abundance of the potentially competing predators. Y = CPUE of sm. bass + CPUE of walleye Stasko et al. 201x, 2 LITERATURE CITED Ali M.A., Ryder R.A. & Anctil, M. (1977) Photoreceptors and visual pigments as related to behavioural responses and preferred habitats of perches (Perca spp.) and pikeperches (Stizostedion spp.). Journal of the Fisheries Research Board of Canada, 34, 1475-1480. Anderson D.R. (2008). Model Based Inference in the Life Sciences: A Primer on Evidence. Springer, Dordecht, The Netherlands. Carter M., Shoup D., Dettmers J.M. & Wahl D.H. (2010) Effects of turbidity and cover on prey selectivity of adult smallmouth bass. Transactions of the American Fisheries Society, 139, 353-361. Frey A.P., Bozek M.A., Edwards C.J. & Newman S.P. (2003) Diet overlap and predation between smallmouth bass and walleye in a north temperate lake. Journal of Freshwater Ecology, 18, 43-54. Galster B.J., Wuellner M.R. & Graeb B.D.S. (2012) Walleye Sander vitreus and smallmouth bass Micropterus dolomieu interactions: an historic stable-isotope analysis approach. Journal of Fish Biology, 81, 135-147. Johnson F.H. & Hale J.G. (1977) Interrelations between walleye (Stizostedion vitreum vitreum) and smallmouth bass (Micropterus dolomieu) in four northeastern Minnesota lakes, 194869. Journal of the Fisheries Research Board of Canada, 34, 1626-1632. Johnson M.G., Leach J.H., Minns C.K. & Olver C.H. (1977) Limnological characteristics of Ontario lakes in relation to associations of walleye (Stizostedion vitreum vitreum), northern pike (Esox lucius), lake trout (Salvelinus namaycush), and smallmouth bass (Micropterus dolomieu). Journal of the Fisheries Research Board of Canada, 34, 15921601. Kaufman S.D., Gunn J.M., Morgan G.E. & Couture P. (2006) Muscle enzymes reveal walleye (Sander vitreus) are less active when larger prey (cisco, Coregonus artedi) are present. Canadian Journal of Fisheries and Aquatic Sciences, 63, 970-979. Lester N.P., Dextrase A.J., Kushneriuk R.S., Rawson M.R. & Ryan P.A. (2004) Light and temperature : Key factors affecting walleye abundance and production. Transactions of the American Fisheries Society, 133, 588-605. Liao H., Pierce C.L. & Larscheid J.G. (2002) Diet dynamics of the adult piscivorous fish community in Spirit Lake, Iowa, USA 1995-1997. Ecology of Freshwater Fish, 11, 178189. Marshall T.R. & Ryan P.A. (1987) Abundance patterns and community attributes of fishes relative to environmental gradients. Canadian Journal of Fisheries and Aquatic Sciences, 44, 198-215. Ryder R.A. & Kerr S.R. (1978) The adult walleye in the percid community – a niche definition based on feeding behaviour and food specificity. American Fisheries Society Special Publication Series, 11, 39-51. Scott W.B. & Crossman E.J. (1973) The Freshwater Fishes of Canada. Fisheries Research Board of Canada, Ottawa, Canada. Sweka J.A. & Hartman K.J. (2003) Reduction of reactive distance and foraging success in smallmouth bass, Micropterus dolomieu, exposed to elevated turbidity levels. Environmental Biology of Fishes, 67, 341-347. Stasko et al. 201x, 3 Table S2. Isotopic niche dimension metrics calculated for walleye and smallmouth bass populations in 34 Boreal Shield lakes. NA indicates the species was not present in the lake. Smallmouth Bass Lake Name Walleye SDNND SEAE CRE NRE SDNND SEAE CRE NRE Addie 0.20 1.95 2.92 0.92 0.22 2.58 2.74 1.16 Andy 0.13 2.18 2.80 1.02 0.12 2.12 2.70 0.98 Bear 0.39 4.38 4.16 1.28 0.14 1.10 1.93 0.78 Carafel 0.31 6.64 4.01 2.10 0.06 1.85 3.11 2.04 Crooked 0.23 6.52 3.50 2.33 0.29 6.35 3.43 2.23 Cutler 0.55 4.85 4.72 1.24 0.15 3.73 4.01 1.12 Deerhound 0.34 2.94 2.55 1.39 0.15 1.79 1.60 1.44 Giroux 0.13 4.25 4.91 1.37 0.15 3.08 2.60 1.51 Herridge 0.20 8.38 4.17 2.50 0.14 12.27 4.27 4.05 Isabella 0.26 3.57 3.13 1.66 0.32 9.26 3.28 3.74 Jacob 0.14 4.53 4.09 1.48 0.16 5.66 3.59 1.91 Kakakiwaganda 0.26 1.87 1.58 1.53 0.16 4.77 5.51 1.04 Little Panache 0.15 0.78 1.43 0.66 0.24 3.72 4.32 1.16 Makami 0.26 2.43 3.26 0.99 0.29 4.83 3.76 1.54 Maple 0.17 8.73 6.73 2.10 0.14 4.45 5.58 0.97 McFarlane 0.22 3.30 2.21 1.85 0.09 0.96 0.94 1.26 Opeechee 0.21 4.85 4.28 1.39 0.27 3.33 2.74 1.47 Pike 0.61 7.74 4.73 4.03 0.60 5.75 3.91 1.98 Pishabo 0.24 2.47 2.09 1.47 0.24 5.02 3.86 1.65 Richardson 0.40 3.30 4.56 1.67 0.16 0.56 1.02 0.66 Salmon Trout 0.17 10.63 9.03 1.92 0.25 2.33 3.33 1.12 Shillington 0.38 2.82 5.33 1.01 0.37 7.21 4.41 2.02 Shoofly 0.66 3.73 4.50 1.00 0.43 8.51 4.97 2.08 Smith 0.18 4.27 2.89 2.14 0.34 2.03 1.98 1.52 St. Leonard 0.21 3.07 3.30 1.12 0.24 4.79 2.56 2.31 Thieving Bear 0.28 2.76 2.82 1.19 0.11 2.43 2.89 1.02 Twin 0.32 16.61 7.07 3.53 0.50 9.23 6.57 2.42 Wilson 0.18 8.22 8.21 1.86 0.14 4.93 3.82 1.61 Stasko et al. 201x, 4 Table S3. Isotopic interaction metrics calculated for sympatric walleye and smallmouth bass populations in 28 Boreal Shield lakes. SEADIFF and SDNNDDIFF were calculated by subtracting smallmouth bass values from those of walleye. Interaction Metrics Lake Name Addie DBC 1.83 % Overlap 0.61 % C Overlap 44.06 % N Overlap 11.50 SEADIFF -0.62 SDNNDDIFF 0.02 Andy 3.38 0.00 0.00 0.00 0.06 -0.01 Bear 1.45 0.00 63.34 0.00 3.28 -0.26 Carafel 1.56 13.49 79.26 33.75 4.79 -0.25 Crooked 0.72 65.45 89.54 72.61 0.16 0.06 Cutler 1.28 0.18 88.78 0.61 1.12 -0.40 Deerhound 0.59 43.01 77.10 59.89 1.15 -0.19 Giroux 1.24 33.94 69.17 46.84 1.17 0.03 Herridge 1.42 60.23 75.15 70.74 -3.89 -0.05 Isabella 1.91 30.47 57.45 50.74 -5.69 0.06 Jacob 1.47 19.79 77.93 29.10 -1.13 0.02 Kakakiwaganda 2.31 14.78 36.83 55.65 -2.90 -0.10 Little Panache 0.74 34.67 49.88 72.85 -2.94 0.10 Makami 1.88 0.00 66.51 0.00 -2.40 0.03 Maple 2.05 36.43 69.16 48.79 4.28 -0.04 McFarlane 0.67 33.65 59.54 57.57 2.33 -0.13 Opeechee 1.46 7.00 77.16 14.45 1.51 0.06 Pike 0.57 51.60 90.45 65.92 1.99 0.00 Pishabo 1.88 15.53 47.98 31.95 -2.55 0.00 Richardson 2.40 1.32 14.69 56.55 2.74 -0.24 Salmon Trout 2.15 0.00 53.93 0.00 8.30 0.08 Shillington 2.06 6.26 67.51 13.13 -4.39 0.00 Shoofly 1.31 15.33 86.50 25.41 -4.78 -0.23 Smith 0.95 23.64 81.39 48.22 2.23 0.16 St. Leonard 2.08 4.19 38.72 38.54 -1.72 0.03 Thieving Bear 1.77 0.00 53.58 0.00 0.33 -0.18 Twin 2.87 44.13 59.37 74.51 7.38 0.18 Wilson 1.74 1.90 63.50 15.52 3.29 -0.04 Stasko et al. 201x, 5 Figure S1. Ellipse plots of isotopic niches for walleye (black circles, solid ellipse) and smallmouth bass (open circles, dashed ellipse) calculated for all lakes in this study. Axes on all plots are identical. Stasko et al. 201x, 6 Stasko et al. 201x, 7 Stasko et al. 201x, 8 Stasko et al. 201x, 9 Stasko et al. 201x, 10 Stasko et al. 201x, 11 Stasko et al. 201x, 12
