Lesson_6 Solving Exponentials with Technology
advertisement
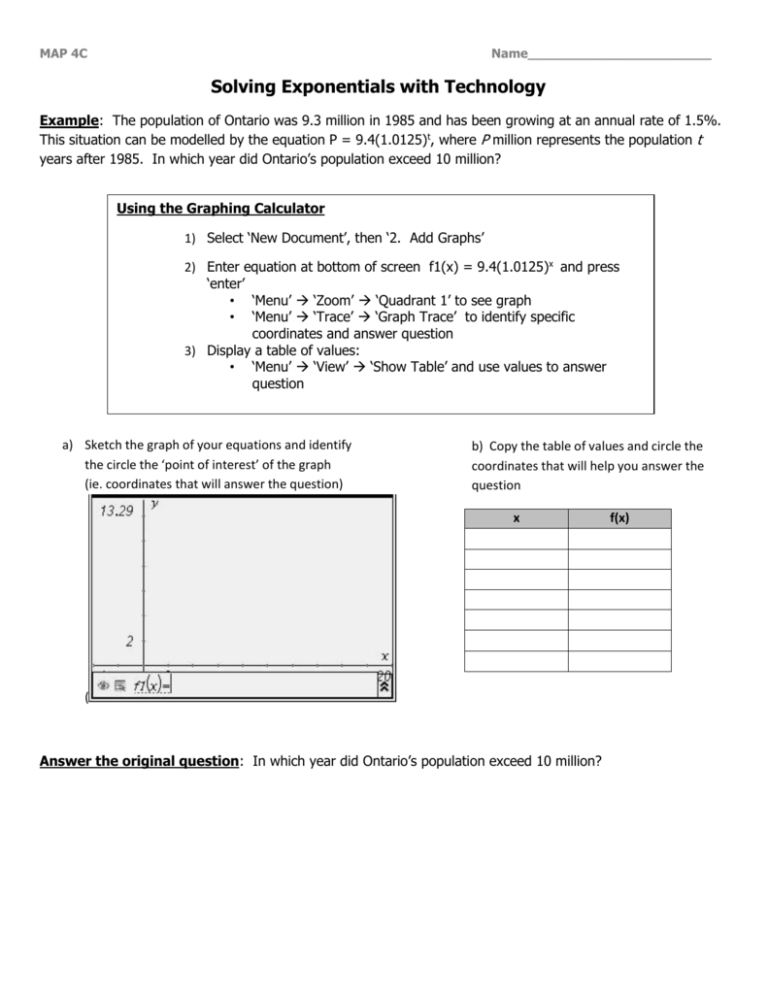
MAP 4C Name_______________________ Solving Exponentials with Technology Example: The population of Ontario was 9.3 million in 1985 and has been growing at an annual rate of 1.5%. This situation can be modelled by the equation P = 9.4(1.0125)t, where P million represents the population t years after 1985. In which year did Ontario’s population exceed 10 million? Using the Graphing Calculator 1) Select ‘New Document’, then ‘2. Add Graphs’ 2) Enter equation at bottom of screen f1(x) = 9.4(1.0125)x and press ‘enter’ • ‘Menu’ ‘Zoom’ ‘Quadrant 1’ to see graph • ‘Menu’ ‘Trace’ ‘Graph Trace’ to identify specific coordinates and answer question 3) Display a table of values: • ‘Menu’ ‘View’ ‘Show Table’ and use values to answer question a) Sketch the graph of your equations and identify the circle the ‘point of interest’ of the graph (ie. coordinates that will answer the question) b) Copy the table of values and circle the coordinates that will help you answer the question x ( Answer the original question: In which year did Ontario’s population exceed 10 million? f(x) MAP 4C Name_______________________ Solving Exponentials with Technology For each of the following, sketch a graph of the equation (label values on the x and y axes for reference) and complete the table of values then use this information to answer the question. 1. Dye is injected into a pancreas to test its function. The mass, R grams of dye remaining in a healthy pancreas after t minutes is given by R = I(0.96)t, where I is the mass of dye originally injected. Suppose 0.50g of dye is injected into a healthy pancreas. How long will it take until 0.35g of dye remains? x f(x) 2. Suppose you invest $500 at 6% per year, compounded annually. The value, A dollars, of your investment after n years is given by A=500(1.06)n. After approximately how many years will the investment grow to each amount: a. $600 b. $1000 c. $1200 x f(x)


![Session [#] Sample Lesson #1 - John C. Fremont High School](http://s3.studylib.net/store/data/007512117_1-6242eca1fe2a29cbffd7b58be3877ac4-300x300.png)
