quantum_dot_antibody
advertisement
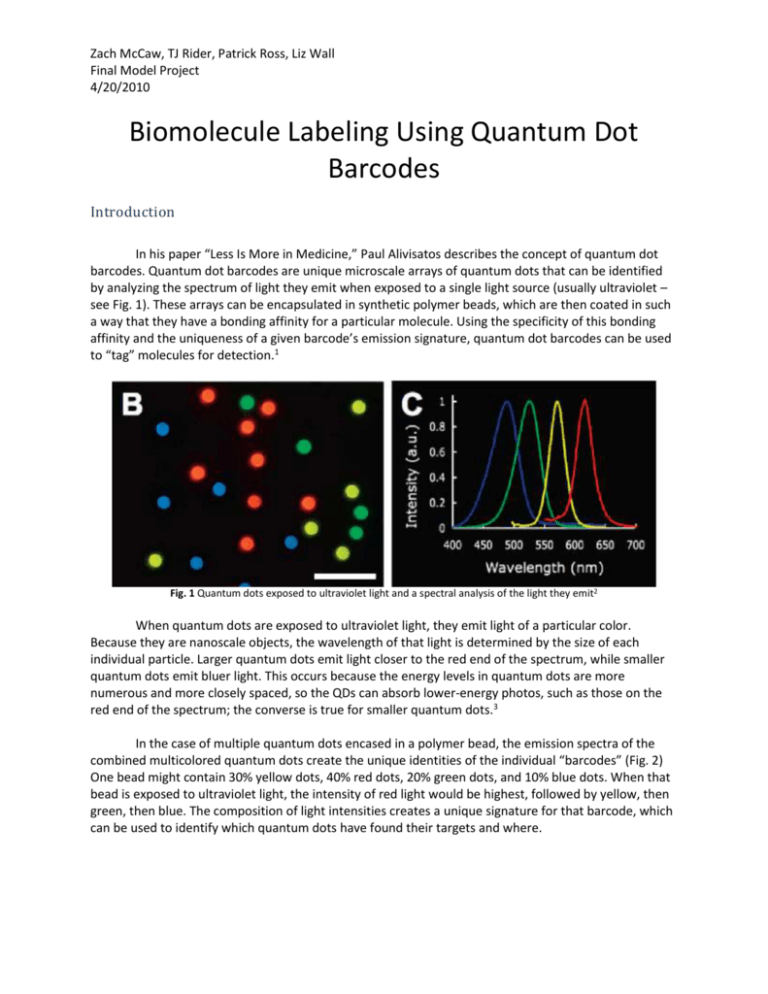
Zach McCaw, TJ Rider, Patrick Ross, Liz Wall Final Model Project 4/20/2010 Biomolecule Labeling Using Quantum Dot Barcodes Introduction In his paper “Less Is More in Medicine,” Paul Alivisatos describes the concept of quantum dot barcodes. Quantum dot barcodes are unique microscale arrays of quantum dots that can be identified by analyzing the spectrum of light they emit when exposed to a single light source (usually ultraviolet – see Fig. 1). These arrays can be encapsulated in synthetic polymer beads, which are then coated in such a way that they have a bonding affinity for a particular molecule. Using the specificity of this bonding affinity and the uniqueness of a given barcode’s emission signature, quantum dot barcodes can be used to “tag” molecules for detection.1 Fig. 1 Quantum dots exposed to ultraviolet light and a spectral analysis of the light they emit2 When quantum dots are exposed to ultraviolet light, they emit light of a particular color. Because they are nanoscale objects, the wavelength of that light is determined by the size of each individual particle. Larger quantum dots emit light closer to the red end of the spectrum, while smaller quantum dots emit bluer light. This occurs because the energy levels in quantum dots are more numerous and more closely spaced, so the QDs can absorb lower-energy photos, such as those on the red end of the spectrum; the converse is true for smaller quantum dots.3 In the case of multiple quantum dots encased in a polymer bead, the emission spectra of the combined multicolored quantum dots create the unique identities of the individual “barcodes” (Fig. 2) One bead might contain 30% yellow dots, 40% red dots, 20% green dots, and 10% blue dots. When that bead is exposed to ultraviolet light, the intensity of red light would be highest, followed by yellow, then green, then blue. The composition of light intensities creates a unique signature for that barcode, which can be used to identify which quantum dots have found their targets and where. Zach McCaw, TJ Rider, Patrick Ross, Liz Wall Final Model Project 4/20/2010 Fig. 2 The differences in spectral analyses from the different assortments of quantum dots allow for distinguishing between barcodes2 The beads that encapsulate quantum dot barcodes can be outfitted with either antibodies or portions of DNA strands. The unique bonding characteristics of the beads’ coating enable specific beadantigen pairing and identification (Fig. 3). The beads are introduced to the body and the body is illuminated with ultraviolet light. The beads can be found anywhere throughout the body floating in solution, but where the beads have bonded to their targets they are likely to be found in a higher concentration. Fig. 3 QD barcodes can be coated with either DNA strands or antibodies so that they can attach to their intended target molecules Antigens Zach McCaw, TJ Rider, Patrick Ross, Liz Wall Final Model Project 4/20/2010 Antibodies in Antigen Labeling An antigen is any molecule that is recognized as non-native by the immune system. Most antigens are proteins or polysaccharides present on the surface of pathogenic organisms or compounds. An antibody is a protein with a specific antigen recognition domain. The epitope is a region of the antigen with a particular shape and charge distribution. Affinity between the epitope and recognition domain allows an antibody to bind its specific antigen. A spectrum of antibodies, each specific to one antigen, is produced by variation in the position and identity of the amino acids that compose the antigen recognition site. The presence of bound antibodies on a pathogen serves to inhibit its movement, and serve as a molecular flag for attack by cytotoxic or macrophage cells. The production of antibodies is mediated by a pair of immune cells: plasmocytes and helper Tcells. During maturation each plasmocyte selects a random combination of three genes that are used to produce the recognition domain of an antibody. These genes encode for a variable, a diversity, and a joining polypeptide segment (VDJ segments). In conjunction these segments form a signature receptor which antibodies produced by the plasmocyte use to bind a particular antigen. Trial receptors are expressed on the surface of the plasmocyte. When a trial receptor comes in contact with an antigen, the target is internalized by the plasmocyte, processed, and loaded into a superficial MHC II complex. This protein structure presents the antigen to a helper T-cell. The helper T-cell, which discriminates between native and foreign molecules, stimulates the plasmocyte if the antigen in the MHC II is not recognized. The stimulated plasmocyte then proliferates and secretes independent (not membrane-bound) antibodies into the system.4 Immunoglobulin G (IgG), depicted in Figure 7, is the most abundant antibody in human serum. IgG is composed of two light and two heavy polypeptide chains. The interaction of one light and one heavy chain produces the branch or ab-fragment (𝐹𝑎𝑏 ), and is modeled by the parallel cylinders that diverge from the central axis. The heavy chain extends downward to form the stem or c-fragment (𝐹𝑐 ), and is modeled by the longer sequential cylinders that flank the central axis. In each IgG, a pair of identical branches diverges from a common stem. Among the upper and lower fragments, each pair of adjacent cylinders represents orthogonal pleated sheets (rotated in plane) that act as a scaffold for the overall structure. The variable VDJ segments are terminal components of both the light and heavy chains. These segments interact to from the antigen recognition site at the end of each branch, depicted as the square-pyramidal pockets. The tetrad of polypeptide chains is linked by disulfide bridges that impart flexibility and durability to the structure. This permits an IgG molecule to bind and adhere to an irregular surface. The disulfide bridges that link the heavy chains in the c-fragment are shown in green; those that link the heavy and light chains in the ab-fragment are shown in blue. The intersection of the two red cylinders at the 𝐹𝑐 terminal serves as the site of quantum dot attachment.4 To construct a probe system the target molecule is first isolated and introduced to a model system, for example a mouse. Antibodies produced in the model system serve as the primary antigen Zach McCaw, TJ Rider, Patrick Ross, Liz Wall Final Model Project 4/20/2010 markers. These antibodies are then introduced to a different model system. A fluorescent label is covalently linked to antibodies produced in the second model, against the primary marker, at the 𝐹𝑐 terminal. This two component label system allows the labeled antibodies to be recycled. Antibodies are a standard feature of protein recognition in Western Blots. In this procedure sample proteins are separated via gel electrophoresis and targets are marked with labeled antibody probes. With use of quantum dots, antibody-mediated protein recognition may be extended for the simultaneous demarcation of numerous proteins within a living system, rather than an extract. Quantum dots are ideal for this function because particles with different wavelength signatures can be created from a single biocompatible material, and combinations of variable size quantum dots within a bead of appropriate size can be used to create bar codes with unique spectral signatures. In immediate practice antibodies labeled with quantum dots beads could be used to observe the movements, concentrations, and interactions of the proteins responsible for both wild type function and pathogenesis within model organisms. In the long term this visualization technology might be extended for use in human subjects, where in vivo observation of protein patterns from the cytological to the systems level would be utilized for studies in such areas as drug delivery, organ transplant, and gene therapy. Moreover the range of quantum dot labels is not restricted to use with antibodies; nucleic acid probes based on complementarity have genetic applications in genotyping, gene regulation, and gene interaction studies. As much of molecular biology depends on the ability to determine what molecules are present, and in what concentrations, at a specified place and time, the use of quantum dot bar codes for labeling procedures has multifarious applications.5 Model We chose to model both types of quantum dot “tagging” – using antibodies to attach the quantum dot to an antigen and using DNA strands. To model a quantum dot we encased three LEDs in a bubble container from a quarter vending machine, weighted with a stack of pennies (Fig. 5). Fig. 5 The quantum dot model We created both a “visual” model and a “working” model of HIV. The “visual” model was created from a hollowed out foam ball, and shows the internal and external structure of the virus (Fig. Zach McCaw, TJ Rider, Patrick Ross, Liz Wall Final Model Project 4/20/2010 6A). The “working” model was also created from a hollowed out foam ball, but a 9-volt battery was placed inside with wires leading out from it (Fig. 6B). Fig. 6 “Visual” and “working” models of HIV To simulate the interaction between antibodies and antigens as well as the labeling of antigens with quantum dots, we attached magnets to the quantum dot and to the working HIV model and placed the wire terminals on either side of the magnets so that the circuit would be completed when the quantum dot and the virus bind to one another (Fig. 7). Fig. 7 The quantum dot binds to the HIV and the LEDs turn on Our model is very obviously not to scale. Quantum dots are typically a few nanometers across,3 while HIV is about 120nm in diameter.4 The beads in which the quantum dots are encased, however, are micrometers in diameter – hundreds to thousands of times larger than HIV or quantum dots. Were our model actually to scale, the LEDs might be approximately the same size, but the bubble that encases them would be several orders of magnitude larger. Zach McCaw, TJ Rider, Patrick Ross, Liz Wall Final Model Project 4/20/2010 Finally, we also modeled human immunoglobulin G (Fig. 8). We constructed it from K’Nex pieces, which offered flexibility to demonstrate IgG’s ability to change shape. Fig. 8 Immunoglobulin G Application With quantum dot barcodes, large samples would not be needed to perform tests for the presence of particular pathogens or genes. Therefore the entire operation could be confined to a microfluidics chip and external spectral analysis equipment (Fig. 9). Such portability of diagnostic equipment would make the diagnosis of deadly viruses like HIV in impoverished places much easier and more cost-effective, and could potentially save millions of lives. Fig. 9 Diagram of a system for detection of pathogens and size comparison for microfluidics chip2 Zach McCaw, TJ Rider, Patrick Ross, Liz Wall Final Model Project 4/20/2010 References 1. Alivisatos, Paul A. “Less Is More in Medicine.” Understanding Nanotechnology. Ed. Sandy Fritz. New York: Warner Books, 2002. 56-69. Print. 2. Klostranec, Jesse M., Qing Xiang, Gabriella A. Farcas, Jeongjin A. Lee, Alex Rhee, Erin I. Lafferty, Steven D. Perrault, Kevin C. Kain, and Warren C. W. Chan. “Convergence of Quantum Dot Barcodes with Microfluidics and Signal Processing for Multiplexed High-Throughput Infectious Disease Diagnostics.” Nano Letters 7.9 (2007): 2812-2818. Web. 3. Reed, Mark A. “Quantum Dots.” Scientific American (January 1993): 118-123. Web. 4. Widmaier, E., H. Raff, and K. Strang (2006). Vander's human physiology. New York: McGraw Hill. 5. Campbell and Reece (2004). Biology, 7th edition. San Francisco: Pearson. 6. Gentile, M., T. Adrian, A. Scheidler, M. Ewald, F. Dianzani, G. Pauli, H.R. Gelderblom. “Determination of the size of HIV using adenovirus type 2 as an internal length marker.” Journal of Virological Methods 48.1 (1994): 43-52. Web.

