Word
advertisement
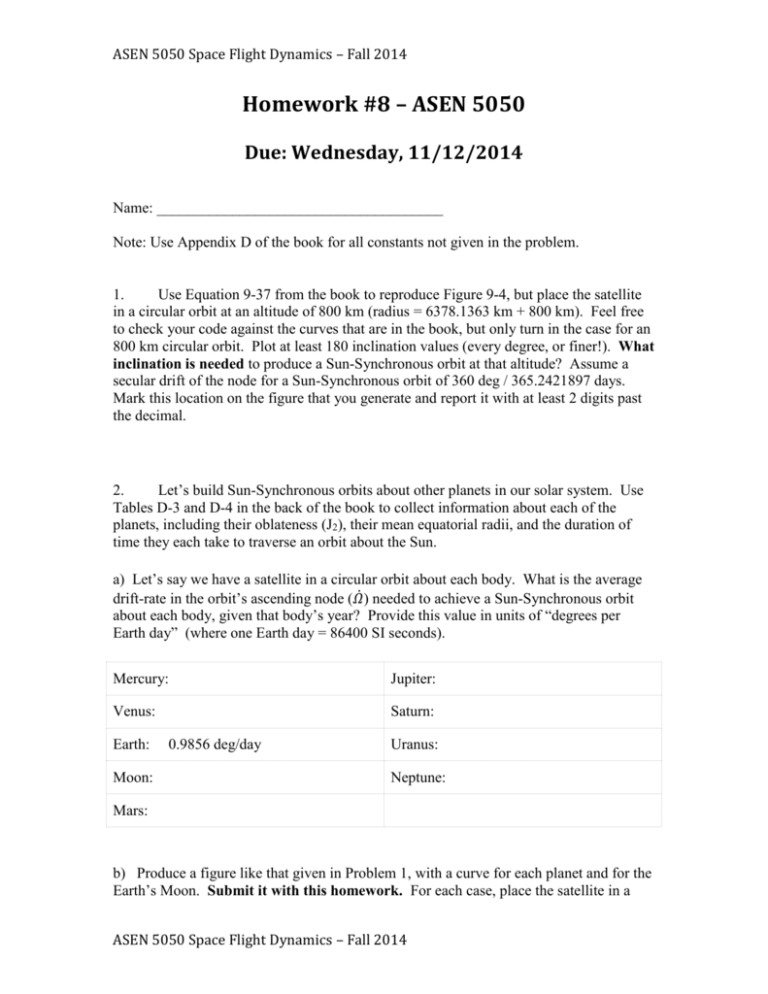
ASEN 5050 Space Flight Dynamics – Fall 2014 Homework #8 – ASEN 5050 Due: Wednesday, 11/12/2014 Name: ______________________________________ Note: Use Appendix D of the book for all constants not given in the problem. 1. Use Equation 9-37 from the book to reproduce Figure 9-4, but place the satellite in a circular orbit at an altitude of 800 km (radius = 6378.1363 km + 800 km). Feel free to check your code against the curves that are in the book, but only turn in the case for an 800 km circular orbit. Plot at least 180 inclination values (every degree, or finer!). What inclination is needed to produce a Sun-Synchronous orbit at that altitude? Assume a secular drift of the node for a Sun-Synchronous orbit of 360 deg / 365.2421897 days. Mark this location on the figure that you generate and report it with at least 2 digits past the decimal. 2. Let’s build Sun-Synchronous orbits about other planets in our solar system. Use Tables D-3 and D-4 in the back of the book to collect information about each of the planets, including their oblateness (J2), their mean equatorial radii, and the duration of time they each take to traverse an orbit about the Sun. a) Let’s say we have a satellite in a circular orbit about each body. What is the average drift-rate in the orbit’s ascending node (𝛺̇ ) needed to achieve a Sun-Synchronous orbit about each body, given that body’s year? Provide this value in units of “degrees per Earth day” (where one Earth day = 86400 SI seconds). Mercury: Jupiter: Venus: Saturn: Earth: Moon: 0.9856 deg/day Uranus: Neptune: Mars: b) Produce a figure like that given in Problem 1, with a curve for each planet and for the Earth’s Moon. Submit it with this homework. For each case, place the satellite in a ASEN 5050 Space Flight Dynamics – Fall 2014 ASEN 5050 Space Flight Dynamics – Fall 2014 circular orbit with an altitude of 800 km above the mean radius of the body (use the equatorial radius from Tables D-3 and D-4). This figure should plot inclination on the xaxis and 𝛺̇ on the y-axis, in units of “degrees per Earth day”. A single plot with a different line for each planet would be nice, but separate plots for each planet are acceptable. Using these plots, determine the inclination of a SunSynchronous orbit about each of these planets. Note: it may not be possible to have a Sun-Synchronous orbit about some planets. Note 2: ignore the fact that Uranus is tilted virtually on its side – we’ll pretend it’s oriented like the other planets for now. Moon: Target inclination: Mercury: Target inclination: Venus: Target inclination: Earth: Target inclination: Mars: Target inclination: Jupiter: Target inclination: Saturn: Target inclination: Uranus: Target inclination: Neptune: Target inclination: 3. Let’s say we have a satellite in an elliptical orbit about the Earth, with the following orbital elements at some time t0: Perigee altitude: 400 km Apogee altitude: 1000 km Inclination: 51.5 deg Right ascension of ascending node: 0 deg Argument of perigee: 60 deg True anomaly: 0 deg The satellite is experiencing only two-body acceleration and a single other perturbing forcing function (not actually a force, but an acceleration). The forcing acceleration is a constant 1 × 10⁻⁶ m/s2 in the orbit-normal direction, perhaps caused by a small gas leak. Use Equations 9-12 (page 626) and/or 9-24 (page 636) of the book to answer the ASEN 5050 Space Flight Dynamics – Fall 2014 ASEN 5050 Space Flight Dynamics – Fall 2014 following questions. a) Which orbital elements will be directly affected by the perturbation, relative to pure two-body motion? b) Will there be any secular drift to any orbital elements caused by this perturbation? Remember: this orbit is not circular. Which elements, if any? c) Use two-body orbit propagation to propagate the satellite’s state around the orbit (this is a pretty fair approximation, given the other perturbation is small). Make two plots, illustrating the effects of the perturbing acceleration. Plot the rate-ofchange of each orbital element that is affected by the perturbation over the course of an orbital period, where the x-axis is True Anomaly (for figure 1) and Time (for figure 2). Plot the rates in degrees per day. Is there evidence for a secular drift in any orbital element? It may not be obvious – try exaggerating the orbit to something like a 400 x 40,000 km elliptical orbit and using that to help draw conclusions. ASEN 5050 Space Flight Dynamics – Fall 2014

