ExamTutorials.Com-MTH-157-CHECKPOINT
advertisement
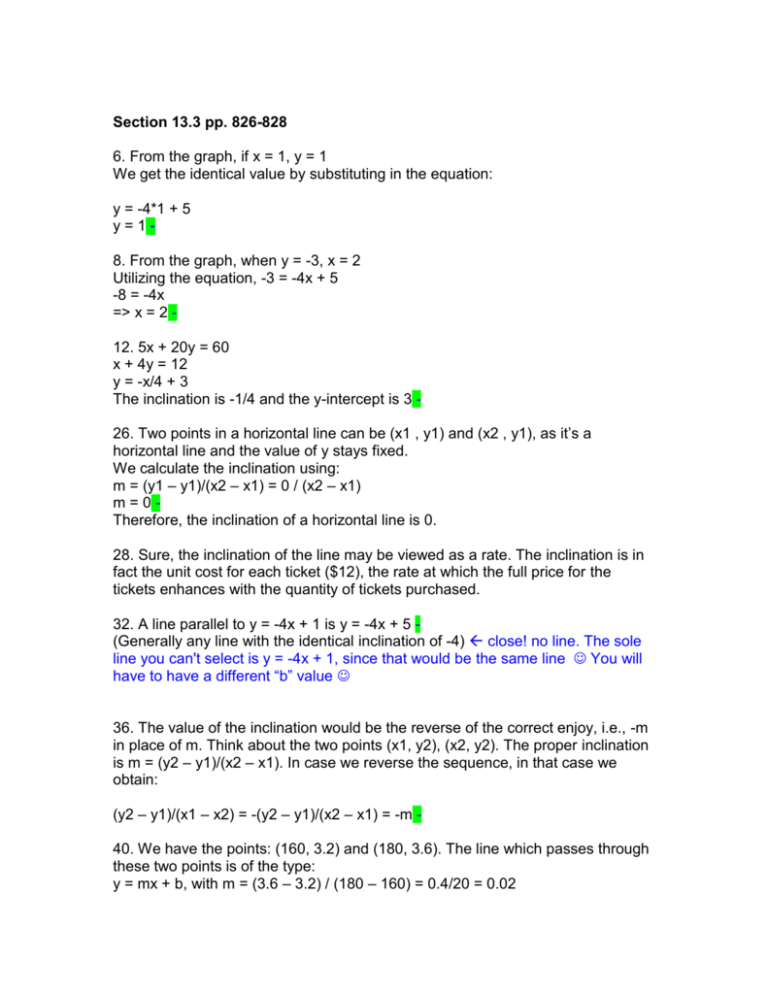
Section 13.3 pp. 826-828 6. From the graph, if x = 1, y = 1 We get the identical value by substituting in the equation: y = -4*1 + 5 y=18. From the graph, when y = -3, x = 2 Utilizing the equation, -3 = -4x + 5 -8 = -4x => x = 2 12. 5x + 20y = 60 x + 4y = 12 y = -x/4 + 3 The inclination is -1/4 and the y-intercept is 3 26. Two points in a horizontal line can be (x1 , y1) and (x2 , y1), as it’s a horizontal line and the value of y stays fixed. We calculate the inclination using: m = (y1 – y1)/(x2 – x1) = 0 / (x2 – x1) m=0Therefore, the inclination of a horizontal line is 0. 28. Sure, the inclination of the line may be viewed as a rate. The inclination is in fact the unit cost for each ticket ($12), the rate at which the full price for the tickets enhances with the quantity of tickets purchased. 32. A line parallel to y = -4x + 1 is y = -4x + 5 (Generally any line with the identical inclination of -4) close! no line. The sole line you can't select is y = -4x + 1, since that would be the same line You will have to have a different “b” value 36. The value of the inclination would be the reverse of the correct enjoy, i.e., -m in place of m. Think about the two points (x1, y2), (x2, y2). The proper inclination is m = (y2 – y1)/(x2 – x1). In case we reverse the sequence, in that case we obtain: (y2 – y1)/(x1 – x2) = -(y2 – y1)/(x2 – x1) = -m 40. We have the points: (160, 3.2) and (180, 3.6). The line which passes through these two points is of the type: y = mx + b, with m = (3.6 – 3.2) / (180 – 160) = 0.4/20 = 0.02 the value of b is found from: 3.2 - 0.02 * 160 = b = 0 Hence, the connection is: y = .02x. a) In case x = 175, then y = 3.5; a mother ostrich weighing 175 lb will lay an egg which weights 3.5 lb b) In case x = 190, in that case y = 3.8; a mom ostrich with a weight 190 lb will lay an egg which weights 3.8 lb - Section 13.4 pp. 847-850 4. The midpoint is at x = (x2 + x1)/2 = 10/2 = 5 y = (y2 + y1)/2 = 10/2 = 5 Therefore, the mid-point is at M(5, 5) 8. The x-coordinate of the end-point is: x = 4*2 – 0 = 8 Which means the y-coordinate is: y = -3*2 – 0 = -6 Hence, the coordinates of the other end-point are M(8,-6) 14. d (15 7) 2 (4 3) 2 485 22.02 28. Inclination m = -6 / 8 = -3/4 y-intercept = 6 Equation: y = (-3/4)x + 6 30. Equation 1: y = -x – 1 Equation 2: y = 4x/3 + 2 To solve the system, -x – 1 = 4x/3 + 2 -3 = 7x/3 x = -9/7 y = 9/7 – 1 = 2/7 The solution is (-9/7, 2/7) 32. The equation is: ( x 1) 2 ( y 2) 2 1 - Bear in mind you should also display 4 your work for each question 42. The lines are perpendicular - 50. The first circle features center at (-2, 6) and radius 4 The second circle features center at (-2, 6) and radius 9 The area between the circles is: (92 42 ) (81 16) 65 204.2 sq. units. 52. In case the two spots have coordinates (x1, y1) and (x2, y2), in that case the basic principle is: Cab distance = |x2 – x1| |y2 – y1| 54. a) First method is by substituting the value of x=6 into the equation, and computing y. If y=9, in that case the point (6,9) is covered by the equation. If not, the point is not covered by the equation. b) A second method is replacing y=9 into the equation and computing x. In case x=6, then the point (6.9) is covered by the equation. If not, the point is not covered.Chapter 13 review p 852-853 2. The amount of hours in one day is a constant. The value of that constant is 24. 6. An equation which displays the connection is: Cost(h) = 9.50 * h + 35 where h is the number of hours. 4 x 18 18 65 18 4 x 83 10. 4 x 83 4 4 83 x 20.75 4 14. The roots are the values of x at where y=0 (the graph intercepts the x-axis.) From the graph, we have 2 real roots: x= -5, and x = 3 18. The inclination is: m = (20 – 11) / (18 – 3) = 9 / 15 = 3/5 22. d (0 5) 2 (12 5) 2 25 49 74 8.6 26. y = -4x + 9 - 30. No, not each straight line can be written in the type y = mx + b. For instance, a vertical line is of the type x = c, with c a constant. Obviously, a vertical line’s equation does not have the type y = mx + b 34. The y-intercept is 0. Therefore, the perpendicular line is x y 4 38. Graph of a quadratic function with just one solution (the graph intercepts the x-axis in just one point) Graph of a quadratic equation having two solutions (the graph intercepts the xaxis in two distinct points) The quantity of real solutions is provided by the quantity of points at which the graph intercepts the x-axis.
