Physics AP C_UNIT #1
advertisement
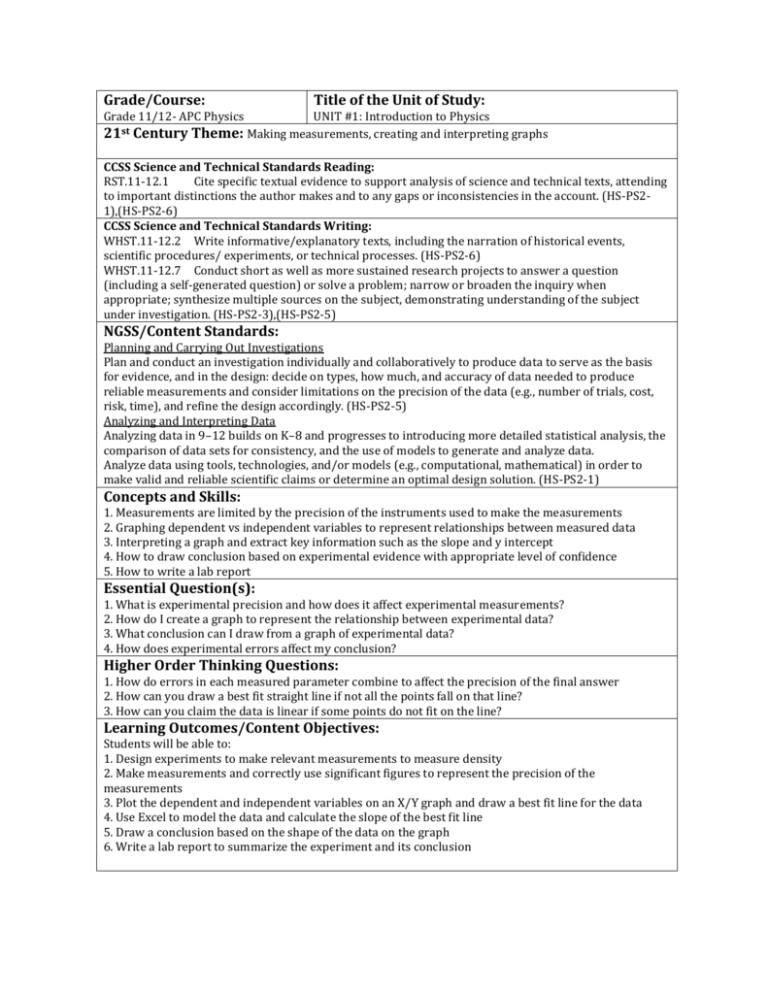
Grade/Course: Grade 11/12- APC Physics Title of the Unit of Study: UNIT #1: Introduction to Physics 21st Century Theme: Making measurements, creating and interpreting graphs CCSS Science and Technical Standards Reading: RST.11-12.1 Cite specific textual evidence to support analysis of science and technical texts, attending to important distinctions the author makes and to any gaps or inconsistencies in the account. (HS-PS21),(HS-PS2-6) CCSS Science and Technical Standards Writing: WHST.11-12.2 Write informative/explanatory texts, including the narration of historical events, scientific procedures/ experiments, or technical processes. (HS-PS2-6) WHST.11-12.7 Conduct short as well as more sustained research projects to answer a question (including a self-generated question) or solve a problem; narrow or broaden the inquiry when appropriate; synthesize multiple sources on the subject, demonstrating understanding of the subject under investigation. (HS-PS2-3),(HS-PS2-5) NGSS/Content Standards: Planning and Carrying Out Investigations Plan and conduct an investigation individually and collaboratively to produce data to serve as the basis for evidence, and in the design: decide on types, how much, and accuracy of data needed to produce reliable measurements and consider limitations on the precision of the data (e.g., number of trials, cost, risk, time), and refine the design accordingly. (HS-PS2-5) Analyzing and Interpreting Data Analyzing data in 9–12 builds on K–8 and progresses to introducing more detailed statistical analysis, the comparison of data sets for consistency, and the use of models to generate and analyze data. Analyze data using tools, technologies, and/or models (e.g., computational, mathematical) in order to make valid and reliable scientific claims or determine an optimal design solution. (HS-PS2-1) Concepts and Skills: 1. Measurements are limited by the precision of the instruments used to make the measurements 2. Graphing dependent vs independent variables to represent relationships between measured data 3. Interpreting a graph and extract key information such as the slope and y intercept 4. How to draw conclusion based on experimental evidence with appropriate level of confidence 5. How to write a lab report Essential Question(s): 1. What is experimental precision and how does it affect experimental measurements? 2. How do I create a graph to represent the relationship between experimental data? 3. What conclusion can I draw from a graph of experimental data? 4. How does experimental errors affect my conclusion? Higher Order Thinking Questions: 1. How do errors in each measured parameter combine to affect the precision of the final answer 2. How can you draw a best fit straight line if not all the points fall on that line? 3. How can you claim the data is linear if some points do not fit on the line? Learning Outcomes/Content Objectives: Students will be able to: 1. Design experiments to make relevant measurements to measure density 2. Make measurements and correctly use significant figures to represent the precision of the measurements 3. Plot the dependent and independent variables on an X/Y graph and draw a best fit line for the data 4. Use Excel to model the data and calculate the slope of the best fit line 5. Draw a conclusion based on the shape of the data on the graph 6. Write a lab report to summarize the experiment and its conclusion Academic Vocabulary: - Scientific Method - lab Report section names - accuracy vs precision - significant figures - dependent and independent variables Content Specific Vocabulary: - Slope = Rise / Run Sentence Frames: - Y intercept - Micrometer or Vernier Calipers - experimental errors Labs/Demonstrations/Activities: 1. Dazoo activity 2. In class discussion about the strength and weaknesses of the scientific method 3. Density of paper lab Resources: Web quiz: http://cwx.prenhall.com/cgi-bin/binder/syl.cgi?site=giancoli Dazoo worksheet Lab Report Exemplar/ Graphing Scaffolding Serway Faughn Vuille: College Physics Textbook Chapter 1 End of Unit Assessment: Design experiment to calculate density Create a graph and write up lab report to measure the density of paper. Homework: see AP UNIT #1 READING / ASSIGNMENT SHEET on Haiku – see below Lab Report: Unit #1 Lab Report Quiz: Illuminated multiple choice summative assessment to test understanding of accuracy vs precision and how to significant figures in compound measurements HAIKU PAGE 1: AP C Unit #1: INTRODUCTION to PHYSICS Topic Reading 1. Overview of AP Physics SFV Chapter 1 SFV p17 Summary SFV p(1-7) Homework Get/Review Textbook HAIKU Log On SFV p19: 1-4 2. Measurement/SI Units Dimensional Analysis 3. Lab Skills – Unit #1 SFV p(7 - 9) Lab Report Significant Figures SFV p19: 7-9 4. Unit Conversions/ SFV p(9-13) SFV p20: 16,17, 27,32 Order of Magnitude Estimates WEB QUIZ1 5. Unit Test WEB QUIZ: http://cwx.prenhall.com/cgi-bin/binder/syl.cgi?site=giancoli (Giancoli – Chapter 1 ; Practice Questions – Email results to: L_Leslie@sbcglobal.net before Friday at 5 pm ) In Class Work Unit 1 Concept Warm Ups Unit 1 Focus Notes Class Participation Max Score 10 10 10 Score
