Word 97 - Wright State University
advertisement
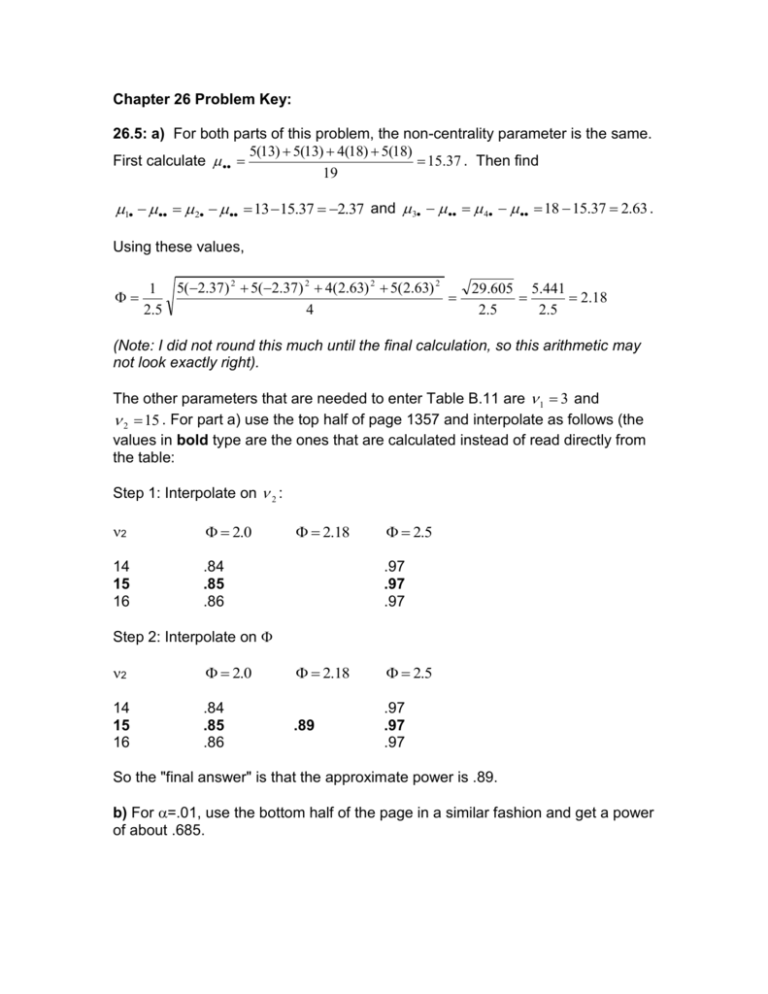
Chapter 26 Problem Key: 26.5: a) For both parts of this problem, the non-centrality parameter is the same. 5(13) 5(13) 4(18) 5(18) 15.37 . Then find First calculate 19 1 2 13 15.37 2.37 and 3 4 18 15.37 2.63 . Using these values, 1 5(2.37) 2 5(2.37) 2 4(2.63) 2 5(2.63) 2 2.5 4 29.605 5.441 2.18 2.5 2.5 (Note: I did not round this much until the final calculation, so this arithmetic may not look exactly right). The other parameters that are needed to enter Table B.11 are 1 3 and 2 15 . For part a) use the top half of page 1357 and interpolate as follows (the values in bold type are the ones that are calculated instead of read directly from the table: Step 1: Interpolate on 2 : 2 2.0 14 15 16 .84 .85 .86 2.18 2.5 .97 .97 .97 Step 2: Interpolate on 2 2.0 2.18 2.5 14 15 16 .84 .85 .86 .89 .97 .97 .97 So the "final answer" is that the approximate power is .89. b) For =.01, use the bottom half of the page in a similar fashion and get a power of about .685. 26.9: For both parts of this problem, a=4, b=3, n=6, =.05, and =20. a) Use Formula (26.4b) to calculate : 1 nb i2 a 1 6(3) (10) 2 (7) 2 (3) 2 (0) 2 711 26.67 1.33 20 4 20 20 1=a-1=3 and 2=ab(n-1)=60. Use the table on the top half of p. 1357 and interpolate between the values for =1.0 and =1.5. I get about .56 as the power. b) Use Formula (26.4c) to calculate : 1 na 2j b 1 6(4) (4) 2 (8) 2 (4) 2 768 27.71 1.39 20 3 20 20 1=b-1=2 and 2=60. Use the table on the top half of page 1356 and interpolate to get the power is approximately .55. 26.14: In problem 23.10, we have a 3-factor design with a=3, b=2, c=2, and n=4. In part f of that problem, the main effect of A is to be tested at =.01. Using rule 2 1 bcn i , where i i . (26.5), a 97 95 90 94 . Then calculate 1=97-94=3, 2=95-94=1, 3 and 3=90-94=-4. Then First calculate 1 2(2)( 4) 3 2 12 (4) 2 3.93 . Also 1=a-1=2 and 2=abc(n-1)=36. Use 3.0 3 the bottom half of page 1356 and get power is approximately 1.0. 26.19: For both parts of this problem, =.05, =.10 (so 1-=.90), and =max(i)min(i)=50. a) For r=6, 50 25 20 / 1 2 2.5 n 34 10 7 Generally, as decreases, the sample size necessary to attain a given power decreases. b) For r=4, 50 25 20 / 1 2 2.5 n 30 9 6 For a smaller number of factor levels, it takes fewer observations to attain the same power. 26.21: In the Questionnaire color problem (16.11), we have a single-factor design with r=3. We're given =3.0 and told to use equal sample sizes. a) =4.5, so /=1.5. Also 1-=.90 and =.05. Use the top part of Table B.12 on page 1362 to get n=13. b) n=13, =.05, =6.0, so /=2.0. Use Table B.12 backwards to hunt for the power. With these parameters, a power of .70 is attained with a sample size = 5, a power of .80 is attained with a sample size=6, power of .90 is attained with sample size=8, and power of .95 is attained with sample size=9. Since the sample size of 13 exceeds all of these, the power is .95. c) Although you might have stumbled on the answer for this part by starting out with n=13, I'll take you through a step or two using a different starting point of 1 n=10. Note first that the Tukey multiplier is T q(.95;3,3(n 1)) and the 2 2 standard error of the difference in two means is sYi Yi ' 3.0 . Starting with n 2 1 3.51 n=10, T q(.95;3,27) 2.482 and sYi Yi ' 3.0 1.34 . So the 10 2 2 precision of the confidence intervals is 2.482(1.34)=3.32, which is too large (but not by much). So we need a larger n. To determine how large, find the ratio of the precision over the desired precision, square this number and multiply it by the current n: 2 3.32 10 12.2 . This suggests that a sample size of 12 is close to large enough 3 to work, so recalculate T and s using n=12: T 1 q(.95;3,33) 2 3.48 2 2.4607 and s Yi Yi ' 3.0 2 1.22474 . 12 For a sample size of n=12, the precision is 2.4607(1.22474)=3.014, which is extremely close to the desired precision. I might be inclined to quit at this point, but technically we need precision that is AT LEAST as low as 3, so let's go one step further and try n=13: T 1 q(.95;3,36) 3.46 2.44659 and sYi Yi ' 3.0 2 2 precision is 2.44659(1.1767)=2.88. 2 1.1767 . The 13 Technically, the necessary sample size is 13 in each group, but I'd probably settle for 12. Notice in this iterative technique how little T changes from step to step. The sample size has a much bigger impact on standard error. 26.26: For the family confidence level to be .90, each of the two Tukey family confidence levels needs to be .95. Note that a=b=3, =7, and we are aiming for a precision of 3. One important decision to be made is whether to include interaction terms in the model or not. The problem states that we will assume that interactions are not important, but I like to include them in the model anyway so that I can check to be sure. The reason this is important is that the error d.f. differ depending on whether a main effects model or a model with interactions is fit. My solution is based on the error d.f. for a model with interactions, which are ab(n-1). Also note that since a=b=3, differences among Factor A means and differences among Factor B means are estimated with the same precision, which is helpful. I'll focus on just differences among Factor A means. Here are the formulas to use: T 1 2 q(.95,3, ab(n 1)) and sYi Yi ' 7 2 . 3n I decided to start with a very small value of n as my first approximation and used n=3. So T 1 q(.95,3,18) 3.61 2.55 and sYi Yi ' 7 2 2 product of these, which is about 8.42. 2 3.30 . The precision is the 9 Clearly I need a much larger n. To see how much larger, calculate 2 8.42 3 23.6 . For n=24, T and s are as follows: 3 2.34 and sYi Yi ' 7 2 1.17 . So for this 72 2 2 sample size the precision is 2.73. Although this looks a little smaller than needed, the precision went back up over 3 when I tried n=23, so this seems to be what is needed. T 1 q(.95,3,207) 3.31

