Lab 2
advertisement
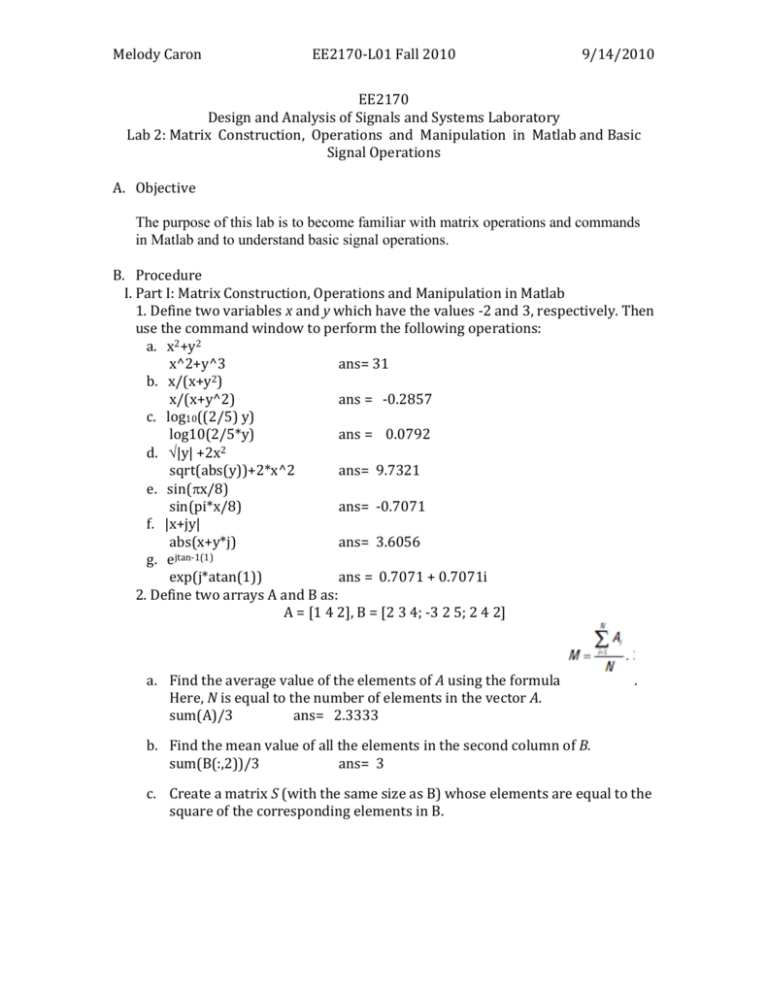
Melody Caron EE2170-L01 Fall 2010 9/14/2010 EE2170 Design and Analysis of Signals and Systems Laboratory Lab 2: Matrix Construction, Operations and Manipulation in Matlab and Basic Signal Operations A. Objective The purpose of this lab is to become familiar with matrix operations and commands in Matlab and to understand basic signal operations. B. Procedure I. Part I: Matrix Construction, Operations and Manipulation in Matlab 1. Define two variables x and y which have the values -2 and 3, respectively. Then use the command window to perform the following operations: a. x2+y2 x^2+y^3 ans= 31 b. x/(x+y2) x/(x+y^2) ans = -0.2857 c. log10((2/5) y) log10(2/5*y) ans = 0.0792 2 d. |y| +2x sqrt(abs(y))+2*x^2 ans= 9.7321 e. sin(x/8) sin(pi*x/8) ans= -0.7071 f. |x+jy| abs(x+y*j) ans= 3.6056 jtan-1(1) g. e exp(j*atan(1)) ans = 0.7071 + 0.7071i 2. Define two arrays A and B as: A = [1 4 2], B = [2 3 4; -3 2 5; 2 4 2] a. Find the average value of the elements of A using the formula Here, N is equal to the number of elements in the vector A. sum(A)/3 ans= 2.3333 . b. Find the mean value of all the elements in the second column of B. sum(B(:,2))/3 ans= 3 c. Create a matrix S (with the same size as B) whose elements are equal to the square of the corresponding elements in B. Melody Caron EE2170-L01 Fall 2010 9/14/2010 S=B.^2 S= 4 9 16 9 4 25 4 16 4 d. Calculate the matrix operation of A x B. A*B ans= -6 19 28 e. Attempt to evaluate ATB and report what appears on the command window. Explain? ??? Undefined function or variable 'T'. “T” is an undefined variable at this point, and it cannot be used in matrix operations until it has been defined. 3. Using “randn” command, produce 100 samples normally distributed, and store them in the 1x100 array C. a. Find the maximum and minimum elements of C. max(C);min(C) ans= 3.5784; -2.9443 b. Find the standard deviation and variance of all the elements of array D = 2xC. std(D);var(D) ans= 2.3248; 5.4047 c. Find the product of all the elements of C. prod(C) ans= -7.3221e-023 II. Part II: Basic Signal Operations 1. First click on the “Basic Signal Operations” applet. Practice using the various controls on this applet. What happens when you adjust the amplitude slider? When you adjust the amplitude slider, the amplitude of the selected function increases or decreases accordingly 2. Describe what happens when you adjust the time shift slider on any of the signals x(t). When you adjust the time shift slider, the signal x(t) shifts left or right along the x axis (time) in the same direction that you move the slider. 3. Repeat #2 when the time shift slider is applied to the signal x(-t). When you apply a time shift to the signal x(-t), the signals shifts along the x axis in the opposite direction that you move the time shift slider. Melody Caron EE2170-L01 Fall 2010 9/14/2010 4. Plot the signal x(t) = u(t) and y(t) = u(t). The signal u(t) is the unit step function. Next, plot 3x(t – 2) + 3y(-t – 2). x(t) = u(t), y(t) = u(t) 3x(t-2)+3y(-t-2) 5. Use the controls on the applet to demonstrate that if y(t) = rect(t – 0.5, 1), then y(-t + 1) = y(t). y(t) = rect(t-0.5, 1) y(-t+1) = y(t) 6. If x(t) = u(t) and y(t) = rect(t – 0.5, 1), plot the graph of x(t + 1) + y(-t + 2). x(t+1) + y(-t+2) 7. If x(t) = rect(t – 0.5, 1), then plot the graph of rect(t, 1). Melody Caron EE2170-L01 Fall 2010 9/14/2010 x(t) = rect(t, 1) 8. Plot the graph of the product exp(-t)u(t)sin(8t). To better understand what is happening mathematically, try filling in the following table (the values can be obtained by positioning the mouse over the graph of each signal, at which time the signal coordinates will turn red): t -3 2.5 -2 1.5 -1 0.5 0 0.5 1 1.5 2 2.5 exp(t)u(t) 0 0 sin(8t) 0 -0.9 exp(t)u(t)sin(8t) 0 0 0 0 0.3 0.5 0 0 0 0 -1 0.8 0 0 1 0.6 0.36 0.22 0.13 0.08 0 -0.7 0.98 -0.5 -0.2 0.91 0 -0.4 0.32 -0.1 0.03 0.07 Melody Caron EE2170-L01 Fall 2010 9/14/2010 exp(-t)u(t)sin(8t) 9. Now bring up the applet called “Sinusoids”. Plot the signals cos(4t) and sin(4t). cos(4t) and sin(4t) 10. Find the smallest positive phase shift, f, such that sin(4t – f) = cos(4t). Insert a plot in your write-up which confirms your answer. Melody Caron t -3 -2 -1 0 1 2 3 EE2170-L01 Fall 2010 cos(4t) = sin(4t -1.5) f = 1.5 cos(4t) 0.84 -0.15 -0.65 1 -0.65 -0.15 -0.84 9/14/2010 sin(4t-1.5) 0.84 -0.15 -0.65 1 -0.65 -0.15 -0.84 11. Explain the difference between a phase shift and a time shift in a sinusoidal signal. Phase shift is used only when describing sinusoidal signals. Time shift is used when describing the shift of any signal, periodic or non-periodic. The term “phase shift” implies that the signal is periodic and its “phase” has been shifted, thus it is in a different phase of the same periodic signal. For example, in the last question I demonstrated that cos(4t) = sin(4t -1.5). The signal when the signal sin(4t) undergoes a phase shift of 1.5, it is in the same “phase” as cos(4t) and is therefore equal. C. Conclusion Through the execution of this lab, I learned how to create matrices in Matlab and perform essential matrix operations. I also discovered some basic properties of signals and signal operations using the specified Java Applet. These skills will be essential to completing more complex labs in the future.
