Text S3. Additional details of global sensitivity analysis
advertisement
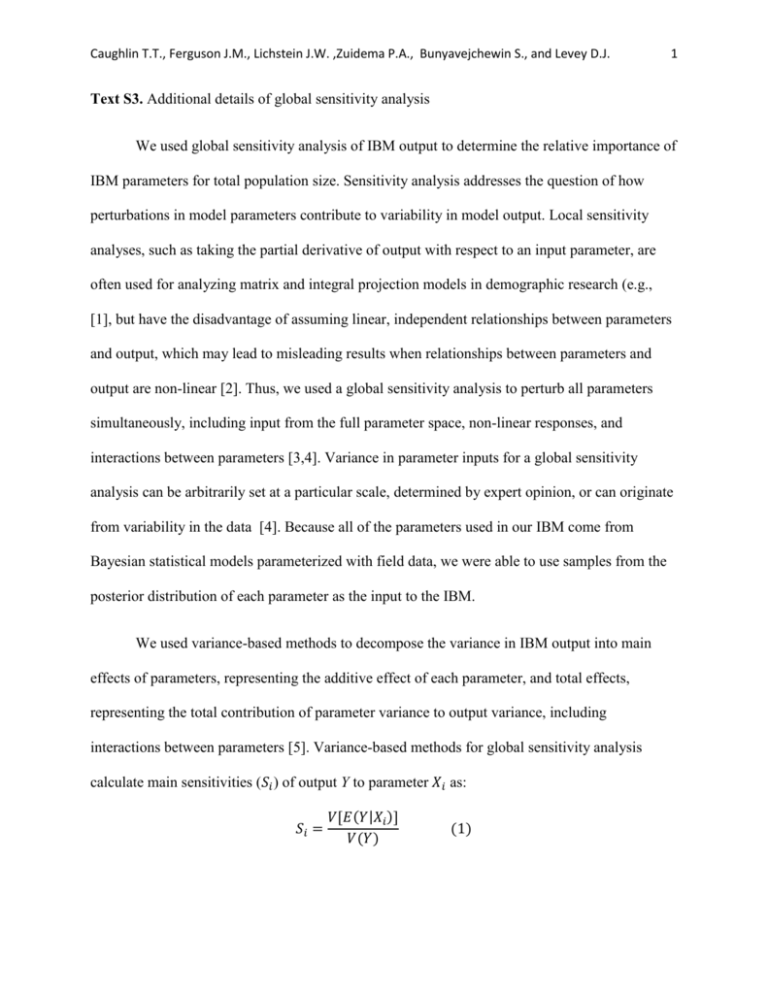
Caughlin T.T., Ferguson J.M., Lichstein J.W. ,Zuidema P.A., Bunyavejchewin S., and Levey D.J. 1 Text S3. Additional details of global sensitivity analysis We used global sensitivity analysis of IBM output to determine the relative importance of IBM parameters for total population size. Sensitivity analysis addresses the question of how perturbations in model parameters contribute to variability in model output. Local sensitivity analyses, such as taking the partial derivative of output with respect to an input parameter, are often used for analyzing matrix and integral projection models in demographic research (e.g., [1], but have the disadvantage of assuming linear, independent relationships between parameters and output, which may lead to misleading results when relationships between parameters and output are non-linear [2]. Thus, we used a global sensitivity analysis to perturb all parameters simultaneously, including input from the full parameter space, non-linear responses, and interactions between parameters [3,4]. Variance in parameter inputs for a global sensitivity analysis can be arbitrarily set at a particular scale, determined by expert opinion, or can originate from variability in the data [4]. Because all of the parameters used in our IBM come from Bayesian statistical models parameterized with field data, we were able to use samples from the posterior distribution of each parameter as the input to the IBM. We used variance-based methods to decompose the variance in IBM output into main effects of parameters, representing the additive effect of each parameter, and total effects, representing the total contribution of parameter variance to output variance, including interactions between parameters [5]. Variance-based methods for global sensitivity analysis calculate main sensitivities (𝑆𝑖 ) of output Y to parameter 𝑋𝑖 as: 𝑆𝑖 = 𝑉[𝐸(𝑌|𝑋𝑖 )] 𝑉(𝑌) (1) Caughlin T.T., Ferguson J.M., Lichstein J.W. ,Zuidema P.A., Bunyavejchewin S., and Levey D.J. 2 The main effect sensitivities can be interpreted as a correlation ratio between parameters and output, and thus sum to one. Total effect sensitivities (𝑆T𝑖 ) decompose output variance 𝑉(𝑌) into the variance due to all parameters but one, 𝑿~𝑖 : 𝑆T𝑖 = 1 − 𝑉[𝐸(𝑌|𝑿~𝑖 )] 𝑉(𝑌) (2) The total sensitivities represent the total contribution of parameters to output variation, and sum to greater than one. To conduct the global sensitivity analysis, we drew 2,000 sets of parameters randomly from the joint posterior parameter distributions. We then applied the winding stairs algorithm [6] to generate a matrix of 82,000 sets of parameters that were used to calculate main effect and total sensitivities. We ran the IBM for 10,000 runs using the parameter sets, each time recording total population size at the 100th time step as output from each run. In order to examine the sampling properties of the winding staircase algorithm we calculated the main effect and total sensitivities for independent parameter sets of sample size s, where s was set to 10, 20, 40, 80, 100, 200, 300, 400, and 500. For each sample-size level, s, we calculated 2000/s independent first-order and total sensitivity values, where 2000 was the number of steps used in the winding staircase algorithm. We then calculated the mean and standard deviation of the at each sample-size level. We estimated the bias as a function of sample size by comparing the average estimate at each sample-size level to the values calculated using all the samples. The trend in bias and standard deviation as a function of sample size allowed us to bias correct our estimates and estimate the standard errors, respectively. Thus, our results use these bias-corrected sensitivities (Table S4). Consistent with theory, we found higher relatively higher standard errors in the main effect Caughlin T.T., Ferguson J.M., Lichstein J.W. ,Zuidema P.A., Bunyavejchewin S., and Levey D.J. 3 sensitivities than the total sensitivities [6]. In general, the bias correction procedure made the first-order sensitivities closer to zero and more similar to the total sensitivities. References 1. Franco, M. & Silvertown, J. 2004 A comparative demography of plants based upon elasticities of vital rates. Ecology 85, 531–538. 2. Morris, W. F. & Doak, D. F. 2002 Quantitative conservation biology: theory and practice of population viability analysis. Sinauer Associates. 3. Ellner, S. P. & Fieberg, J. 2003 Using PVA for management despite uncertainty: effects of habitat, hatcheries, and harvest on salmon. Ecology 84, 1359–1369. 4. Fieberg, J. & Jenkins, K. J. 2005 Assessing uncertainty in ecological systems using global sensitivity analyses: a case example of simulated wolf reintroduction effects on elk. Ecological Modelling 187, 259–280. 5. Saltelli, A., Ratto, M., Andres, T., Campolongo, F., Cariboni, J., Gatelli, D., Saisana, M. & Tarantola, S. 2008 Global sensitivity analysis: the primer. Wiley-Interscience. 6. Chan, K., Saltelli, A. & Tarantola, S. 2000 Winding stairs: a sampling tool to compute sensitivity indices. Statistics and Computing 10, 187–196. Tables Table S3. Main effect sensitivities from global sensitivity analysis. Table S4. Total effect sensitivities from global sensitivity analysis. These tables presents the bias-corrected estimates of main and total effects of parameter uncertainty on total population size after 100 years from simulated populations. Main effects of parameters represent the additive effect of each parameter on population size and total effects represent the total contribution of parameter variance to output variance, including interactions between parameters. Caughlin T.T., Ferguson J.M., Lichstein J.W. ,Zuidema P.A., Bunyavejchewin S., and Levey D.J. Table S3. Main effect sensitivities from global sensitivity analysis. This table presents the bias-corrected estimates of main and total effects of parameter uncertainty on total population size after 100 years from simulated populations. Main effects of parameters represent the additive effect of each parameter on population size. Submodel Parameter Initial distribution Initial conditions of trees Seed dispersal 𝑢. 𝑑𝑖𝑠𝑝𝑒𝑟𝑠𝑎𝑙 𝑓𝑟 Seed production 𝛽0 𝑓𝑟 Seed production 𝛽1 𝑓𝑟 Seed production 𝛽2 Seed dispersal 𝐵𝑎𝑡ℎ 𝑔𝑒𝑟 Germination 𝜇0 Germination 𝛽 𝑔𝑒𝑟 Germination 𝛼 𝑔𝑒𝑟 Germination 𝑑𝑖𝑠. 𝑔𝑒𝑟 Germination μ𝑖𝑛.ℎ𝑡 Germination 𝑠𝑐𝑎𝑙𝑒 𝑖𝑛.ℎ𝑡 Germination 𝑠ℎ𝑎𝑝𝑒 𝑖𝑛.ℎ𝑡 Seedling survival 𝜇0𝑠𝑠 Seedling survival 𝛽 𝑠𝑠 Seedling survival 𝑠𝑖𝑧𝑒 𝑠𝑠 𝑠𝑔 Seedling growth 𝜇0 Main effects Standard Error Main effects 0.008 0.029 0.001 <0.001 <0.001 <0.001 <0.001 0.009 <0.001 <0.001 <0.001 <0.001 <0.001 <0.001 0.016 <0.001 0.02 0.033 0.032 0.032 0.031 0.034 0.032 0.028 0.033 0.034 0.035 0.044 0.038 0.034 0.036 0.039 0.029 0.033 4 Caughlin T.T., Ferguson J.M., Lichstein J.W. ,Zuidema P.A., Bunyavejchewin S., and Levey D.J. Table S3. Main effects and total effect sensitivities from global sensitivity analysis, cont. Submodel Seedling growth Seedling growth Seedling growth Seedling growth Seedling growth Seedling growth Seedling heightDBH allometry Seedling heightDBH allometry Seedling heightDBH allometry Seedling heightDBH allometry Seedling heightDBH allometry Tree survival Tree growth Tree survival Tree growth Tree growth Tree growth Tree survival Tree survival Tree growth Tree growth Tree growth Tree growth 𝛼 𝑠𝑔 𝑑𝑖𝑠. 𝑠𝑔 𝑠𝑖𝑧𝑒 𝑠𝑔 𝛽 𝑠𝑔 𝑠𝑐𝑎𝑙𝑒 𝑠𝑔 𝑠ℎ𝑎𝑝𝑒 𝑠𝑔 0.048 0.052 0.033 0.055 0.019 0.038 Standard Error Main effects 0.029 0.033 0.034 0.034 0.028 0.024 𝑎ℎ𝑡 0.073 0.023 𝑏 ℎ𝑡 0.054 0.028 𝜎 ℎ𝑡 0.044 0.028 𝑎 𝑠𝑤𝑖𝑡𝑐ℎ 0.046 0.035 𝑏 𝑠𝑤𝑖𝑡𝑐ℎ 0.056 0.034 𝛼 𝑎𝑠 𝛼 𝑎𝑔 𝑑𝑖𝑠. 𝑎𝑠 𝑑𝑖𝑠. 𝑎𝑔 𝐺. 𝑔 𝑃. 𝑔 𝐺. 𝑠 𝑃. 𝑠 𝑎𝑠ℎ𝑎𝑝𝑒 𝑎𝑠𝑐𝑎𝑙𝑒 𝑏𝑠ℎ𝑎𝑝𝑒 𝑏𝑠𝑐𝑎𝑙𝑒 0.029 0.017 0.038 0.02 0.057 0.037 0.716 <0.001 <0.001 <0.001 <0.001 <0.001 0.035 0.031 0.029 0.031 0.034 0.032 0.016 0.038 0.034 0.037 0.032 0.031 Parameter Main effects 5 Caughlin T.T., Ferguson J.M., Lichstein J.W. ,Zuidema P.A., Bunyavejchewin S., and Levey D.J. Table S4. Total effects from global sensitivity analysis. This table presents the bias-corrected estimates of total effects of parameter uncertainty on total population size after 100 years from simulated populations. Total effects represent the total contribution of parameter variance to output variance, including interactions between parameters. See Text S2 for more details. Submodel Parameter Initial distribution Initial conditions of trees Seed dispersal 𝑢. 𝑑𝑖𝑠𝑝𝑒𝑟𝑠𝑎𝑙 𝑓𝑟 Seed production 𝛽0 𝑓𝑟 Seed production 𝛽1 𝑓𝑟 Seed production 𝛽2 Seed dispersal 𝐵𝑎𝑡ℎ 𝑔𝑒𝑟 Germination 𝜇0 Germination 𝛽 𝑔𝑒𝑟 Germination 𝛼 𝑔𝑒𝑟 Germination 𝑑𝑖𝑠. 𝑔𝑒𝑟 Germination μ𝑖𝑛.ℎ𝑡 Germination 𝑠𝑐𝑎𝑙𝑒 𝑖𝑛.ℎ𝑡 Germination 𝑠ℎ𝑎𝑝𝑒 𝑖𝑛.ℎ𝑡 Seedling survival 𝜇0𝑠𝑠 Seedling survival 𝛽 𝑠𝑠 Seedling survival 𝑠𝑖𝑧𝑒 𝑠𝑠 𝑠𝑔 Seedling growth 𝜇0 Total effects Standard Error Total effects 0.025 0.005 0.025 0.023 0.024 0.026 0.038 0.061 0.029 0.044 0.052 0.027 0.027 0.028 0.057 0.025 0.035 0.027 0.004 0.004 0.005 0.004 0.006 0.011 0.005 0.008 0.01 0.005 0.005 0.006 0.01 0.004 0.005 0.005 6 Caughlin T.T., Ferguson J.M., Lichstein J.W. ,Zuidema P.A., Bunyavejchewin S., and Levey D.J. Table S4. Total effects from global sensitivity analysis, cont. Submodel Seedling growth Seedling growth Seedling growth Seedling growth Seedling growth Seedling growth Seedling heightDBH allometry Seedling heightDBH allometry Seedling heightDBH allometry Seedling heightDBH allometry Seedling heightDBH allometry Tree survival Tree growth Tree survival Tree growth Tree growth Tree growth Tree survival Tree survival Tree growth Tree growth Tree growth Tree growth 𝛼 𝑠𝑔 𝑑𝑖𝑠. 𝑠𝑔 𝑠𝑖𝑧𝑒 𝑠𝑔 𝛽 𝑠𝑔 𝑠𝑐𝑎𝑙𝑒 𝑠𝑔 𝑠ℎ𝑎𝑝𝑒 𝑠𝑔 0.024 0.025 0.03 0.03 0.03 0.034 Standard Error Total effects 0.004 0.005 0.005 0.007 0.007 0.007 𝑎ℎ𝑡 0.026 0.005 𝑏 ℎ𝑡 0.024 0.004 𝜎 ℎ𝑡 0.024 0.004 𝑎 𝑠𝑤𝑖𝑡𝑐ℎ 0.062 0.01 𝑏 𝑠𝑤𝑖𝑡𝑐ℎ 0.061 0.01 𝛼 𝑎𝑠 𝛼 𝑎𝑔 𝑑𝑖𝑠. 𝑎𝑠 𝑑𝑖𝑠. 𝑎𝑔 𝐺. 𝑔 𝑃. 𝑔 𝐺. 𝑠 𝑃. 𝑠 𝑎𝑠ℎ𝑎𝑝𝑒 𝑎𝑠𝑐𝑎𝑙𝑒 𝑏𝑠ℎ𝑎𝑝𝑒 𝑏𝑠𝑐𝑎𝑙𝑒 0.057 0.039 0.036 0.036 0.094 0.023 0.843 0.03 0.025 0.028 0.029 0.025 0.011 0.007 0.007 0.006 0.02 0.004 0.108 0.008 0.006 0.007 0.007 0.004 Parameter Total effects 7
