bit25896-sup-0001-SuppData-S1
advertisement

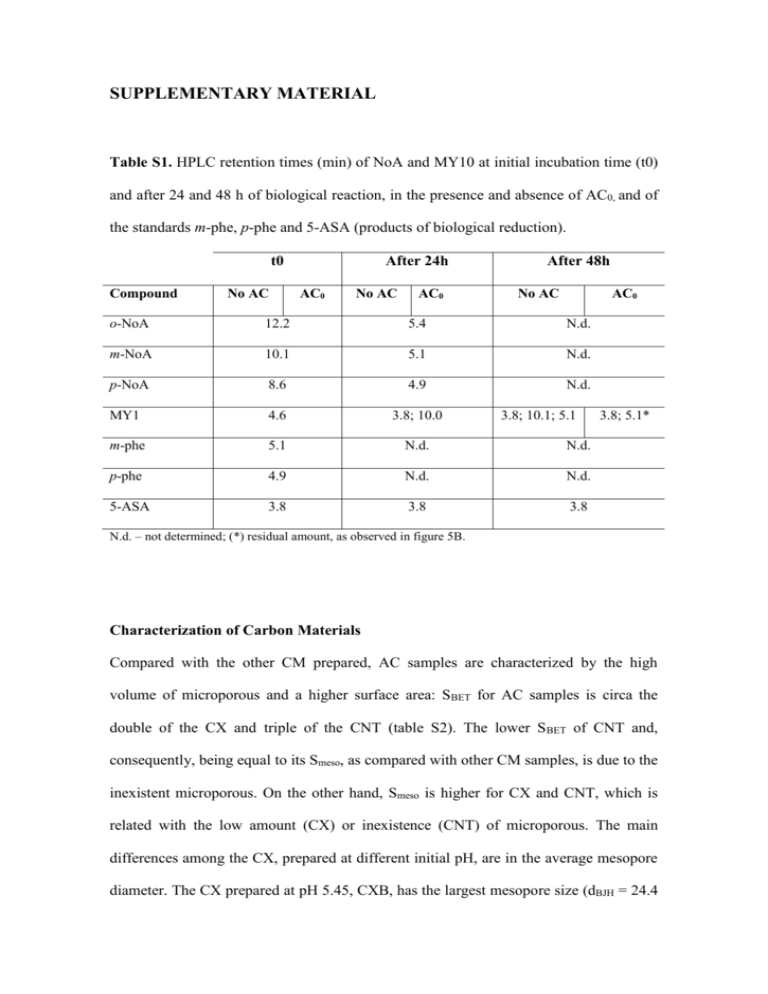
SUPPLEMENTARY MATERIAL Table S1. HPLC retention times (min) of NoA and MY10 at initial incubation time (t0) and after 24 and 48 h of biological reaction, in the presence and absence of AC0, and of the standards m-phe, p-phe and 5-ASA (products of biological reduction). t0 Compound No AC After 24h AC0 No AC AC0 After 48h No AC AC0 o-NoA 12.2 5.4 N.d. m-NoA 10.1 5.1 N.d. p-NoA 8.6 4.9 N.d. MY1 4.6 3.8; 10.0 m-phe 5.1 N.d. N.d. p-phe 4.9 N.d. N.d. 5-ASA 3.8 3.8 3.8 3.8; 10.1; 5.1 3.8; 5.1* N.d. – not determined; (*) residual amount, as observed in figure 5B. Characterization of Carbon Materials Compared with the other CM prepared, AC samples are characterized by the high volume of microporous and a higher surface area: SBET for AC samples is circa the double of the CX and triple of the CNT (table S2). The lower S BET of CNT and, consequently, being equal to its Smeso, as compared with other CM samples, is due to the inexistent microporous. On the other hand, Smeso is higher for CX and CNT, which is related with the low amount (CX) or inexistence (CNT) of microporous. The main differences among the CX, prepared at different initial pH, are in the average mesopore diameter. The CX prepared at pH 5.45, CXB, has the largest mesopore size (dBJH = 24.4 and 3.2 nm for CXB and CXA, respectively). Contrary to the CX samples that have cylindrical pores, the mesoporosity of the CNT sample results from the free space in the CNT bundles, with a pore size distribution between 10 and 24 nm (Orge et al., 2012). Tessonnier et al. (2009) characterized this material as having an average inner and outer diameters of 4 and 10 nm, respectively. Surface oxygen groups on CM decompose upon heating, releasing CO and/or CO2 at different temperatures, allowing to identify and to estimate the amount of oxygenated groups (table S3). As previously reported by our group (Pereira et al., 2010), according to the TPD analysis higher CO and CO2 release is obtained in sample ACHNO3. Indeed, liquid oxidation with HNO3 of AC0 increases the amount of surface oxygen-containing groups, carboxylic, anhydrides and lactones groups. These acidic groups are responsible for the high acidity and the lower pHpzc value obtained for sample ACHNO3 (pHpzc=2.7). On the other hand, thermal treatments at high temperature produce materials with low amount of oxygen containing groups and high basicity, resulting mainly from the ketonic groups remaining on the surface, from the low amount of acidic groups, and from the delocalized π-electrons on the carbon basal planes (Gonçalves et al., 2010). These electrons are responsible for the high basicity of the ACH2 sample (pHpzc=10.4). CNT sample presents lower oxygen-containing surface groups, especially CO releasing groups, which explain the neutral pHpzc (Gonçalves et al., 2010). Table S2. Textural characterization of the tested CM (Pereira et al., 2010; Pereira et al., 2014; Orge et al., 2012). SBET Smeso Vμpores dBJHa (m2 g-1) (m2 g-1) (cm3 g-1) (nm) AC0 1032 138 0.382 - ACHNO3 893 102 0.346 - ACH2 987 129 0.377 - CXA 540 168 0.192 3.2 CXB 566 233 0.165 24.4 CNT 331 331 0 - Sample a Average mesopore diameter obtained by the Barret, Joyner and Halenda (BJH) method applied to the desorption isotherm. Table S3. Chemical characterization of tested CM samples (Figueiredo, 2013; Pereira pHpzc (μmol g-1) quinones Carbonyl/ (μmol g-1) Phenols (μmol g-1) Lactones (μmol g-1) Anhydrides (μmol g-1) Carboxylic acids (μmol g-1) COb CO2a Sample (μmol g-1) et al., 2010, Pereira et al., 2014; Orge et al., 2012; Tessonnier et al., 2013). AC0 243 814 110 79 54 428 307 8.4 ACHNO3 1103 2402 723 222 158 948 1232 2.7 ACH2 59 590 48 0 11 249 341 10.8 CNT 25 478 n.d.c n.d.c n.d.c n.d.c n.d.c 7.0 a Amounts of CO and CO2 released, obtained by integration of the areas under TPD spectra. Mass percentage of oxygen on the surface, obtained from TPD data assuming that all the surface oxygen is released as CO and/or CO2. C Not determined. b Table S4. Previously reported results on nitrocompounds chemical and biological reduction, either in the absence or presence of redox mediators, comparison with the present work. Treatment Redox Compounds Results System Reference Mediator 32%, 56%, 52% and 70% of reduction within 24h at rate 0.07 h-1, 0.26 h-1, 0.14 h-1 and 0.057 h-1 None for o-, m-, p- NoA and Batch assays MY1, respectively with non1 mmol L-1 o-, m-, padapted This work NoA and MY1 anaerobic Total reduction in 12h, granular biomass 4h, 5h and 24h, for o-, m-, 0.1 g L-1 AC0 p- NoA and MY1 at rate 0.15 h-1, 1.14h-1, 1.05 -1 and 0.161 h-1, respectively (adsorption <10%) Chemical Nitrobenzene reduction by sulphides in aqueous 0.3gL-1 Carbon (Yu et al., 0.0367 h-1 2011) Black CB solutions ~20% within 15 days for None 4NP and ~50% within 1 0.5 mmol L-1 of 4Chemical day, for 3CNB (Amezquita- ~90% within 15 days for Garcia et al., 4NP and ~85% within 1 2013) nitrophenol (4.NP) reduction by or 3Na2S in aqueous chloronitrobenzene solutions (3CNB) -1 1 gL Activated day, for 3CNB carbon fibers (adsorption <20%) Very low extent of Chemical 0.08 mmol L-1 reduction by nitrobenzene Na2S in aqueous None reduction r=7.83 × 10⁻⁵ h–1 0.005 gL-1 solutions (Fu and Zhu, 2013) ~70% within 7 days Graphene oxide (GO) r=7.77 × 10⁻³ h–1 ~14 % over 72 h None r=0.0016 h−1 Chemical 0.5 gL-1 of reduction by Black sulphides in carbons from aqueous rice (R-BC), solutions wheat straw ~75 % over 72 h (Gong et -1 0.275 mmol L nitrobenzene al., 2014) R-BC > W-BC > C-BC: (W-BC) and r = 0.0186, 0.0063, and corn (C-BC) 0.0051 h-1, respectively straw ashes MO1: UASB None MO1 reduction occurred (Donlon et al., 0.35 mmol L-1 bioreactors: only with adapted R1without co- biomass: 1997) in R2 and 0.18 substrate, R2 mmolL-1 R1 performance slowly with glucose and dropped over time, failing in R3 R3 with VFA completely by day 50 Anaerobic In R2, 95% and in R3, granular sludge 91% MO1 reduction adapted with (HRT of 8h) increasing MO1 concentrations during 75 days Table S5. VFA consumption in biological assays for the reduction of the azo dye Acid Orange 10 (AO10) (unpublished data) in the absence and presence of 0.1 g L-1 of AC0 or CNT. Experimental Assay Biomass+AO10 Biomass+AO10+AC0 Biomass+AO10+CNT Incubation Time (h) 0 8 24 0 8 24 0 8 24 VFA concentration (mM) Acetic Propionic Butyric Acid Acid Acid 3.37 11.93 11.62 3.49 9.42 11.38 0.76 7.09 11.10 3.30 12.09 12.00 3.34 9.73 11.96 0.60 6.68 11.65 3.63 11.91 11.63 4.45 10.16 11.92 2.73 7.75 11.37 A B C D E F Figure S1. Photography of magenta complex formed from the reaction of Fe2+ (resulted from the reduction by AC0) with ferrozine (duplicate experiments): (A and B) – 0.1 g L1 AC0 and (D and E) – 1.0 g L-1 AC0, previously biologically reduced in the absence and presence of BES, respectively. C and F, are the controls with AC0 (0.1 and 1.0 g L-1, respectively) incubated in the same conditions of biotic experiments, but without biomass.


