Periodic Properties of the Elements Date: Name: Period: Visit the
Periodic Properties of the Elements
Date: _______________________ Name: ______________________________________________
Visit the following website:
Period: ________________________________ http://www.mhhe.com/biosci/genbio/virtual_labs/periodic_table/main.html
When the website appears you should be ready to start the activity. The ‘Laboratory Tab’ should already by clicked and the site ready to do ‘Exploration 1’.
In this activity a partial periodic table is provided. In a complete periodic table, all known varieties of matter are represented and are called ‘elements’. Each rectangle on the periodic table provides the name of the element, it’s atomic number and symbol. Variations exist between the information provided in different periodic tables. Notice the key provided and which elements are considered metals, metalloids or nonmetals. Notice the vertical columns are numbered 1 – 18 and these columns of elements are called groups. On the left side, each row of elements is numbered and referred to as being in the same period.
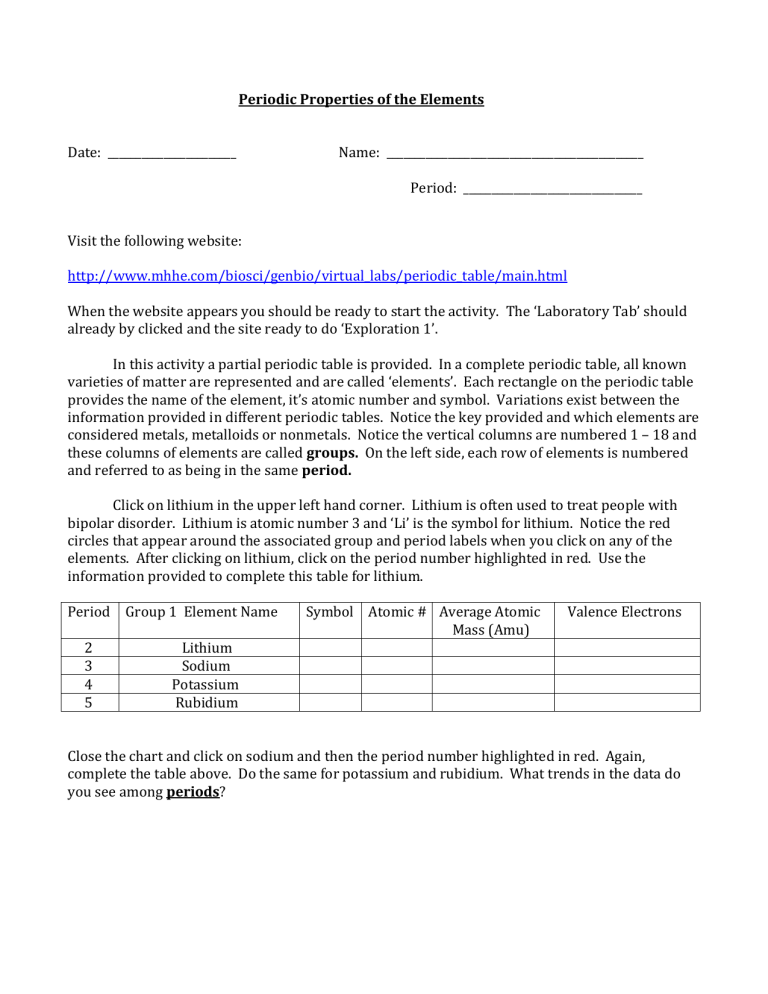
Click on lithium in the upper left hand corner. Lithium is often used to treat people with bipolar disorder. Lithium is atomic number 3 and ‘Li’ is the symbol for lithium. Notice the red circles that appear around the associated group and period labels when you click on any of the elements. After clicking on lithium, click on the period number highlighted in red. Use the information provided to complete this table for lithium.
Period Group 1 Element Name
2 Lithium
Symbol Atomic # Average Atomic
Mass (Amu)
Valence Electrons
3
4
5
Sodium
Potassium
Rubidium
Close the chart and click on sodium and then the period number highlighted in red. Again, complete the table above. Do the same for potassium and rubidium. What trends in the data do you see among periods?
Continue with this similar exercise by completing the table for all the elements in period 2.
Group
1
Group
2
Group
13
Group
14
Group
15
Group
16
Group
17
Group
18
Lithium Beryllium Boron Carbon Nitrogen Oxygen Flourine Neon Period 2
Elements
Symbol
Atomic #
Average Atomic
Mass (amu)
Valence
Electrons
What trends in the data do you see among groups?
Check the number of valence electrons for all the elements in group 14. What trend do you observe?
Do the same for Group 15 and 16. Does the trend continue for valence electrons? __________________
Click on fluorine in group 17. Then click on the red highlighted group 17 label. Notice the graph on the right. The points on this line graph represent the four elements shown in group 17.
The 6 graphs shown are the same for each element in group 17 because the data represents the same four elements in all 6 graphs.
Click on each of the six types of graphs. Interpret (tell the meaning of) each graph. It is not enough to mention what the graph is generally about. Tell what graphing the data reveals about the 4 elements in relationship to each other. Describe any trends observed and how the data on the X axis is related to the data on the Y axis.
Atomic Radius (pm) –
Atomic Mass (amu) -
No. of Valence Electrons –
Electronegativity –
Density –
Melting Point –
