Can short message service reminders improve
advertisement
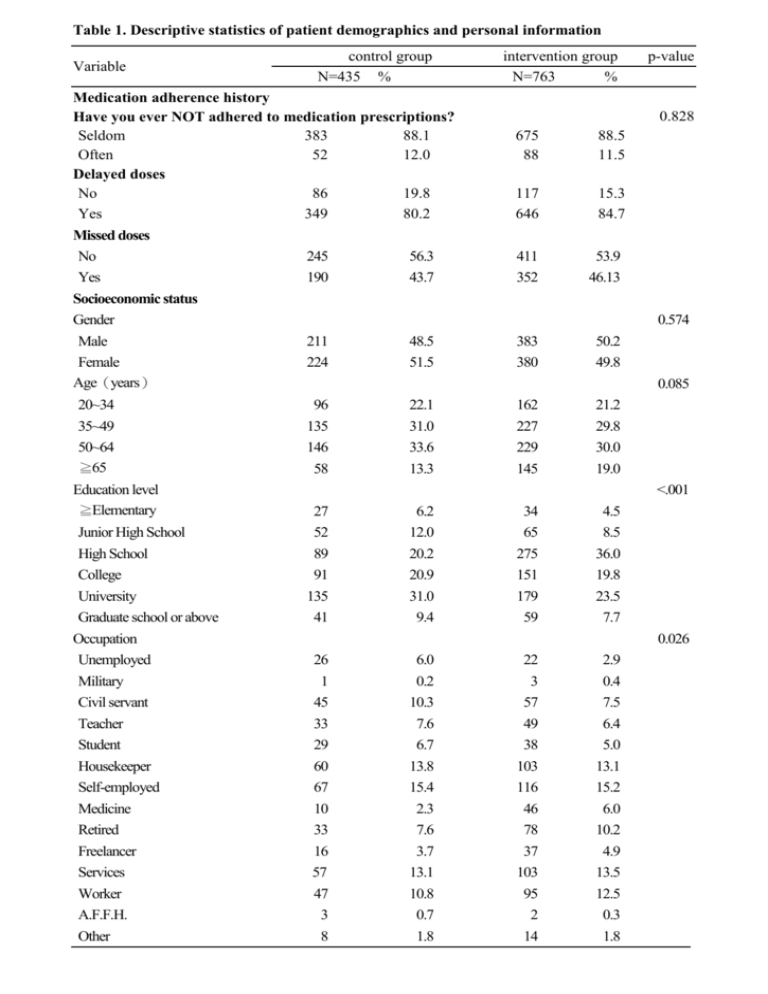
Table 1. Descriptive statistics of patient demographics and personal information Variable control group N=435 % Medication adherence history Have you ever NOT adhered to medication prescriptions? Seldom 383 88.1 Often 52 12.0 Delayed doses No 86 19.8 Yes 349 80.2 Missed doses No Yes Socioeconomic status Gender Male Female Age(years) 20~34 35~49 50~64 ≧65 Education level ≧Elementary Junior High School High School College University Graduate school or above Occupation Unemployed Military Civil servant Teacher Student Housekeeper Self-employed Medicine Retired Freelancer Services Worker A.F.F.H. Other 245 190 56.3 43.7 intervention group N=763 % p-value 0.828 675 88 88.5 11.5 117 646 15.3 84.7 411 352 53.9 46.13 0.574 211 224 48.5 51.5 383 380 50.2 49.8 0.085 96 135 146 58 22.1 31.0 33.6 13.3 162 227 229 145 21.2 29.8 30.0 19.0 <.001 27 6.2 34 4.5 52 89 91 135 41 12.0 20.2 20.9 31.0 9.4 65 275 151 179 59 8.5 36.0 19.8 23.5 7.7 0.026 26 1 45 33 6.0 0.2 10.3 7.6 22 3 57 49 2.9 0.4 7.5 6.4 29 60 67 10 33 16 57 47 3 8 6.7 13.8 15.4 2.3 7.6 3.7 13.1 10.8 0.7 1.8 38 103 116 46 78 37 103 95 2 14 5.0 13.1 15.2 6.0 10.2 4.9 13.5 12.5 0.3 1.8 Table 1. Descriptive statistics of patient demographics and personal information (cont’) Variable Control group N=435 Average monthly household income ≦30,000 NTD 30,001-60,000 NTD 60,001-90,000 NTD 90,001-120,000 NTD 120,001-150,000 NTD ≧15,0001 NTD Missing data Marital status Single Married Divorced/Separated Widowed intervention group % N=763 p-value % 0.025 94 110 93 34 28 71 5 21.6 25.3 21.4 7.8 6.4 16.3 1.2 122 193 152 80 82 125 9 16.0 25.3 19.9 10.5 10.8 16.4 1.2 <.001 108 24.8 178 23.3 259 48 20 59.5 11.0 4.6 409 156 19 53.6 20.5 2.5 0 0.0 1 0.1 Missing data Living status Live with spouse only Live with children only Live with spouse and children Live alone Other 59 81 138 42 115 13.6 18.6 31.7 9.7 26.4 114 162 225 71 191 14.9 21.2 29.5 9.3 25.0 Medical history Heart disease Hypertension Dialysis Stroke Peptic ulcer Thyroid disease Chronic kidney disease Hyperlipidemia Diabetes 79 120 2 51 39 42 9 16 88 18.2 27.6 0.5 11.7 9.0 9.7 2.1 3.7 20.2 142 197 11 45 73 36 13 32 141 18.6 25.8 1.4 5.9 9.6 4.7 1.7 4.2 18.5 0.847 0.505 0.115 0.121 0.731 <.001 0.651 0.662 0.459 3 9 7 4 20 19 8 14 3 105 0.7 2.1 1.6 0.9 4.6 4.4 1.8 3.2 0.7 24.1 8 15 8 2 42 17 3 11 12 190 1.1 2.0 1.1 0.3 5.5 2.2 0.4 1.4 1.6 24.9 0.531 0.903 0.401 <.001 0.496 0.037 0.012 0.039 0.186 0.768 Gynecology disease Asthma/ Emphysema Urinary disease Cancer Chronic liver disease Gout Pneumonia Mental or psychiatric disease Immunity disease Others 0.735 NTD: New Taiwan dollar; A.F.F.H: agricultural, forestry, fishery or husbandry Table 2. Comparing the results before and after the SMS intervention Variable Before SMS intervention N % After SMS intervention N Improvement % P-value % <.001 a Delayed doses (Total) Intervention group 646 84.7c 137 18.0c 78.8 20~34 y/o 146 90.1 32 19.8 78.1 35~49 y/o 181 79.7 52 22.9 71.3 50~64 y/o 196 85.6 35 15.2 82.2 123 84.8 18 12.4 85.4 349 80.2c 187 43.0c 46.4 20~34 y/o 83 86.5 58 60.4 30.1 35~49 y/o 105 77.8 62 45.9 41.0 50~64 y/o ≧65 y/o 113 77.4 54 37.0 52.2 48 82.8 13 22.4 72.9 ≧65 y/o Delayed doses (Total) Control group <.001b <.001b <.001a Missed doses (Total) Intervention group 352 46.1c 35 4.6c 90.1 20~34 y/o 90 55.6 9 5.6 90.0 35~49 y/o 97 42.7 9 4.0 90.7 101 44.1 10 4.4 90.0 64 44.1 7 4.8 89.1 190 43.7c 74 17.0c 61.1 20~34 y/o 52 54.2 28 29.2 46.2 35~49 y/o 62 45.9 14 10.4 77.4 50~64 y/o ≧65 y/o 52 35.6 30 20.6 42.3 24 41.4 2 3.5 91.7 50~64 y/o ≧65 y/o Missed doses (Total) Control group <.001b <.001 b a: used chi-square test to examine the difference between groups; b: Used the McNemar's test to examine the difference between the pre-test and post-test data within the group. c: intervention group % = n/763; control group %=n/435 Table 3. Weighted logistic regression of SMS on decreasing delayed doses Variable OR After SMS intervention No(reference) 3.2 ** Yes 95% CI 2.7 P-value 3.7 <.001 Socioeconomic status Gender Male(reference) Female 0.9 0.7 1.1 0.197 Age (years) Variable Average monthly household income ≦30,000 NTD(reference) 30,001-60,000 NTD 0.8 * 95% CI 0.6 P-value 1.0 0.043 60,001-90,000 NTD 90,001-120,000 NTD 120,001-150,000 NTD 1.6 ** 0.8 0.7 1.2 0.6 0.5 2.1 1.2 1.0 0.001 0.254 0.062 ≧150,001 NTD 2.1 ** 1.5 3.0 <.001 1.7 ** 0.7 1.2 0.5 2.4 1.1 0.005 0.143 0.7 0.4 1.2 0.231 2.7 ** 1.8 4.1 <.001 0.7 ** 0.5 0.9 0.006 0.7 * 0.4 1.0 0.049 1.3 0.9 1.9 0.149 Heart disease 0.7 ** 0.5 0.9 0.001 Hypertension 0.7 ** 0.6 0.9 0.001 Marital status 20~34 (reference) 35~49 0.6 ** 50~64 0.9 0.4 0.6 0.8 0.001 1.2 0.419 Sigle(reference) Married Divorced/Separated ≧65 0.6 1.5 0.955 Widowed 1.0 Education level Living status Elementary or less (reference) Junior High 1.1 0.7 School Live with spouse only(reference) 1.7 0.641 Live with children only High School 2.1 ** 1.4 3.2 <.001 College 1.3 0.8 1.9 0.288 Live with spouse and children Live alone 0.9 0.6 1.5 0.782 Other 0.6 0.4 1.1 0.076 University Graduate school or above Occupation OR Unemployed(reference) Medical history Military 1.4 0.4 5.3 0.582 Dialysis 0.6 0.3 1.3 0.217 Civil servant 0.9 0.5 1.4 0.579 Stroke 0.5 ** 0.4 0.7 <.001 Teacher 2.1 * 1.2 3.6 0.011 Peptic ulcer 1.8 ** 1.2 2.5 0.002 Student Housekeeper Self-employed Medicine Retired Freelancer Services Worker A.F.F.H. Other 1.0 0.6 * 0.9 1.8 0.7 0.7 1.2 0.7 2.7 1.1 0.6 0.4 0.6 1.0 0.4 0.4 0.8 0.4 0.8 0.5 1.7 0.9 1.4 3.5 1.1 1.2 1.8 1.1 9.7 2.1 0.938 0.023 0.611 0.064 0.145 0.234 0.418 0.078 0.127 0.881 Thyroid disease 0.6 ** 0.4 0.8 0.001 Chronic kidney disease 0.7 0.4 1.3 0.285 Hyperlipidemia 1.0 0.7 1.5 0.876 Diabetes 1.0 0.8 1.3 0.930 Gynecology disease 0.9 0.4 1.8 0.672 Asthma/ Emphysema 0.8 0.4 1.3 0.328 Urinary disease 1.0 0.5 2.0 0.992 Cancer 3.9 * 1.0 14.8 0.046 Chronic liver disease 1.3 0.9 2.1 0.199 Gout 1.3 0.8 2.1 0.357 Pneumonia 2.5 0.9 7.0 0.090 Mental or psychiatric 1.0 0.6 1.6 0.884 disease Immunity disease 3.9 ** 1.67 9.0 0.002 Others 0.7 ** 0.52 0.8 <.001 N=1198. Dependent variable: 1 indicates with complete improvement; 0 indicates without complete improvement. Medical history reference group is the participants without this disease; A.F.F.H: agricultural, forestry, fishery or husbandry. * p<0.05; ** p<0.01 Table 4. Weighted logistic regression of SMS on decreasing missed doses Variable OR 95% CI P-value After SMS intervention No(reference) Yes 2.2 ** 1.9 2.6 <.001 Socioeconomic status Gender Male(reference) Female 2.1 ** 1.8 2.6 <.001 Age (years) 20~34(reference) 35~49 0.7 * 0.5 1.0 0.024 50~64 0.7 * 0.5 0.9 0.014 ≧65 0.6 ** 0.4 0.9 0.009 Education level Elementary or less (reference) Junior High School 1.3 0.8 2.0 0.244 High School 0.7 College 0.7 University 0.7 Graduate school or 0.6 * above Occupation Unemployed(reference) Military 0.1 ** Civil servant 0.4 ** Teacher 0.4 ** Student 0.5 ** Housekeeper 0.7 Self-employed 0.7 Medicine 0.7 Retired 0.7 Freelancer 0.9 Services 0.9 Worker 1.3 A.F.F.H. 2.3 Other 1.1 0.5 1.1 0.138 0.5 0.4 1.1 1.0 0.100 0.058 Variable OR 95% CI P-value Average monthly household income ≦30,000 NTD(reference) 30,001-60,000 NTD 1.2 1.0 1.5 0.099 60,001-90,000 NTD 1.5 ** 1.1 1.9 0.006 90,001-120,000 NTD 1.1 0.8 1.5 0.668 120,001-150,000 NTD 2.2 ** 1.5 3.2 <.001 ≧150,001 NTD 4.8 ** 3.4 6.8 <.001 Marital status Single(reference) Married 1.4 1.0 1.9 0.065 Divorced/Separated 0.4 ** 0.3 0.6 <.001 Widowed 1.7 1.0 2.9 0.054 Living status Live with spouse only(reference) Medical history 0.7 0.5 1.1 0.093 Live with spouse and 1.4 * 1.1 1.8 0.013 children Live alone 1.4 0.9 2.1 0.118 Other 0.6 ** 0.4 0.8 0.004 0.4 1.0 0.034 Medical history 0.0 0.2 0.2 0.3 0.4 0.5 0.4 0.5 0.6 0.6 0.8 0.7 0.6 0.3 0.6 0.7 0.8 1.0 1.1 1.3 1.1 1.5 1.4 2.0 7.9 2.1 <.001 <.001 <.001 0.005 0.062 0.136 0.277 0.164 0.711 0.753 0.278 0.190 0.868 Heart disease Hypertension Dialysis Stroke Peptic ulcer Thyroid disease Chronic kidney disease Hyperlipidemia Diabetes Gynecology disease Asthma/ Emphysema Urinary disease Cancer Chronic liver disease Gout Pneumonia Mental or psychiatric disease Others 0.4 ** 0.4 ** 0.5 0.6 ** 0.7 * 0.7 * 0.7 0.8 0.9 1.0 1.0 1.0 1.1 1.4 1.5 1.9 0.3 0.4 0.2 0.4 0.5 0.5 0.4 0.5 0.7 0.5 0.6 0.5 0.4 0.9 0.9 0.7 0.5 0.5 1.0 0.8 0.9 1.0 1.3 1.1 1.1 2.2 1.8 2.2 3.3 2.0 2.3 5.2 <.001 <.001 0.051 0.002 0.014 0.028 0.252 0.186 0.354 0.965 0.917 0.910 0.893 0.111 0.089 0.185 2.2 ** 1.3 3.8 0.003 0.5 ** 0.4 0.6 <.001 N=1,198; Dependent variable: 1 indicates with complete improvement; 0 indicates without complete improvement. Medical history reference group is the participants without this disease. The patients with immunity disease had no decrease on missed doses; A.F.F.H: agricultural, forestry, fishery or husbandry. * p<0.05; ** p<0.01 Table 5. Satisfaction with and demand for the SMS content Weighted Mean SD The SMS clearly describes the frequency of medication use. 3.8 0.7 The SMS clearly describes the method of medication use. 3.8 0.7 Frequency of SMSs received 3.1 1.0 Satisfaction with the precision of wording in the SMS 4.2 0.9 Satisfaction with the understandability of the content of the SMS 4.2 0.8 Satisfaction with medication use privacy in the SMS 4.2 0.9 Overall satisfaction with the SMS 4.3 0.7 Weighted Mean SD Demand for SMS clearly displaying the frequency of medication 2.8 1.0 Demand for SMS clearly showing method of medication 2.5 0.9 Demand for SMS clearly displaying the medication dose 2.9 0.9 Frequency of SMSs received 2.7 0.9 Satisfaction with SMS content (N=763) Demand for SMS content (N=763) SMS: Short message service A 5-point Likert scale, ranging from 1, not at all necessary/extremely unsatisfied, to 5, highly necessary/extremely satisfied. Table 6. Demand for SMS reminders Variable N=763 % Variable N=763 % Preferring time to receive text messages before medication taken Helpfulness of the text message medication reminder in improving the incidence of delayed or missed doses 10 minutes 262 34.3 Very unhelpful 13 1.7 15 minutes 65 8.5 Unhelpful 41 5.4 30 minutes 337 44.2 Neutral 75 9.8 60 minutes 71 9.3 Helpful 401 52.6 others 28 3.7 Very helpful 233 30.5 Necessity of receiving text messages after the time medication should be consumed Benefits of text message medication reminders for disease control Yes 48 6.3 Very unhelpful 14 1.8 No 715 93.7 Unhelpful 55 7.2 Neutral 132 17.3 Helpful 373 48.9 Very helpful 189 24.8 Willingness to recommend the text message service to family and friends Yes 699 91.6 No 64 8.4

