Waste-Water-Treatment
advertisement
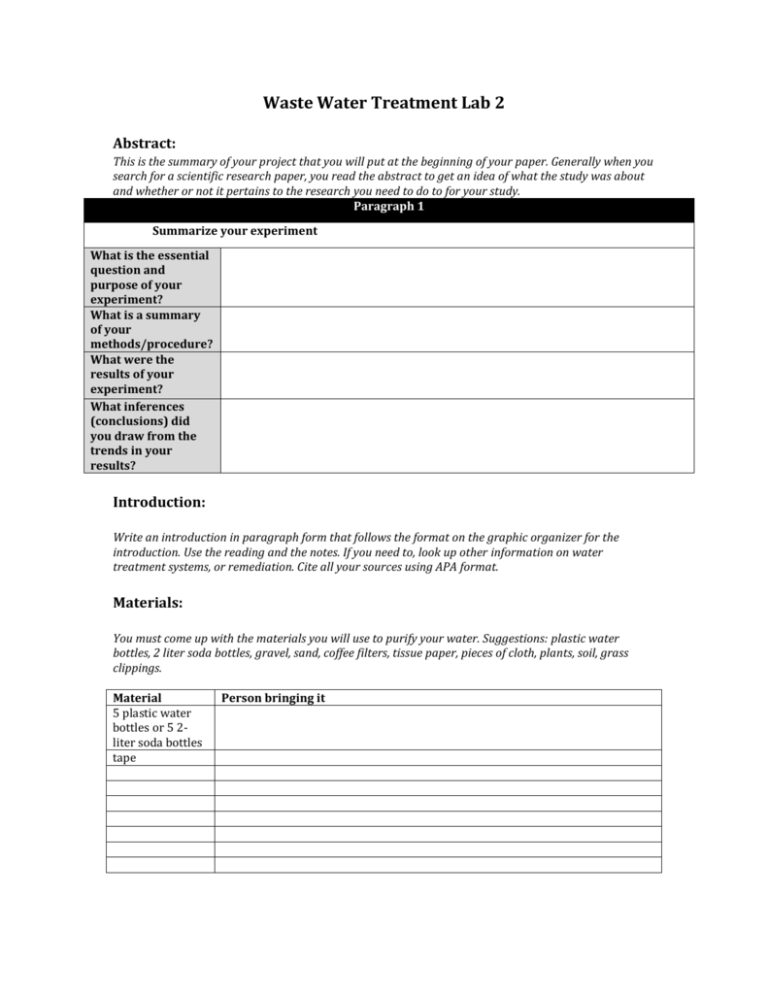
Waste Water Treatment Lab 2 Abstract: This is the summary of your project that you will put at the beginning of your paper. Generally when you search for a scientific research paper, you read the abstract to get an idea of what the study was about and whether or not it pertains to the research you need to do to for your study. Paragraph 1 Summarize your experiment What is the essential question and purpose of your experiment? What is a summary of your methods/procedure? What were the results of your experiment? What inferences (conclusions) did you draw from the trends in your results? Introduction: Write an introduction in paragraph form that follows the format on the graphic organizer for the introduction. Use the reading and the notes. If you need to, look up other information on water treatment systems, or remediation. Cite all your sources using APA format. Materials: You must come up with the materials you will use to purify your water. Suggestions: plastic water bottles, 2 liter soda bottles, gravel, sand, coffee filters, tissue paper, pieces of cloth, plants, soil, grass clippings. Material 5 plastic water bottles or 5 2liter soda bottles tape Person bringing it Procedure: 1. 2. 3. 4. 5. 6. 7. 8. 9. 10. 11. 12. 13. 14. Do background research using the materials that Ms. Hobson gave you and your notes to familiarize yourself with different methods of remediation of waste water (such as sewage). Work with your group to determine a mechanism to filter or purify 200 mL of waste water (of unknown substance…yet ) that you can bring in to class/create in class using materials that you brought in. You will have 50 minutes in class to build your water purification treatment. Plan accordingly. Develop a procedure for Wednesday or Thursday. Write it below. Come prepared (Wednesday or Thursday) with all your materials and ready to work. Complete your water purifier. Ask Ms. Hobson for the “waste water”. Take 5 mL samples of the waste water initially for dissolved oxygen, pH, Nitrogen and Phosphorus. Slowly (in 50 mL parts) pour the waste water through your treatment system, until you reach 200 mL. Let your purifying device sit for one week. Take 5 mL samples of the purified water for dissolved oxygen, pH, Nitrogen and Phosphorus. If you feel confident, add your fish. Let your fish live in the purified water for 1 week. In the meantime, analyze your data in your results. Create your discussion. Data: Trial 1: Table 1: Waste water, 5 mL sample tested on (Dates):__________________ Sample pH Ammonia/Ammonium Nitrite Nitrate Phosphate Before date: After filtration date: Table 2: Distilled water, 5 mL sample tested on (Dates):__________________ Sample Before date: After filtration date: pH Ammonia/Ammonium Nitrite Nitrate Phosphate Table 3: Purified water (varied), 5 mL sample tested on (Dates):_________________ Sample pH Ammonia/Ammonium Nitrite Nitrate Phosphate Before date: After filtration date: Trial 2: Table 1: Waste water, 5 mL sample tested on (Dates):__________________ Sample Dissolved BOD pH Coliform Nitrate phosphate (dates) oxygen bacteria Before testing: temperature turbidity temperature turbidity After filtration: Table 2: Distilled water, 5 mL sample tested on (Dates):__________________ Sample (dates) Before testing: Dissolved oxygen BOD pH Coliform bacteria Nitrate phosphate After filtration: Table 3: Purified/Filtered water (varied), 5 mL sample tested on (Dates):_________________ Sample (dates) Before testing: Dissolved oxygen BOD pH Coliform bacteria Nitrate phosphate temperature turbidity Trial 3 Table 1: Waste water, 5 mL sample tested on (Dates):__________________ Sample Dissolved BOD pH Coliform Nitrate phosphate temperature (dates) oxygen bacteria Before turbidity testing: Table 2: Distilled water, 5 mL sample tested on (Dates):__________________ Sample (dates) Before testing: Dissolved oxygen BOD pH Coliform bacteria Nitrate phosphate temperature turbidity Table 3: Purified/Filtered water (varied), 5 mL sample tested on (Dates):_________________ Sample (dates) Before testing: Dissolved oxygen BOD pH Coliform bacteria Nitrate phosphate temperature turbidity Results: Create a clustered column graph using your data for all three weeks for everything that you tested. Then use it to create a graph in excel. Make sure there are captions. Graph 1: Our results showed __________________________________________________________________________________ ____________________________________________________________________________________________________________________ ____________________________________________________________________________________________________________________ Discussion: Follow the graphic organizer on another sheet.
