Supplementary Material_JCP_Revision
advertisement
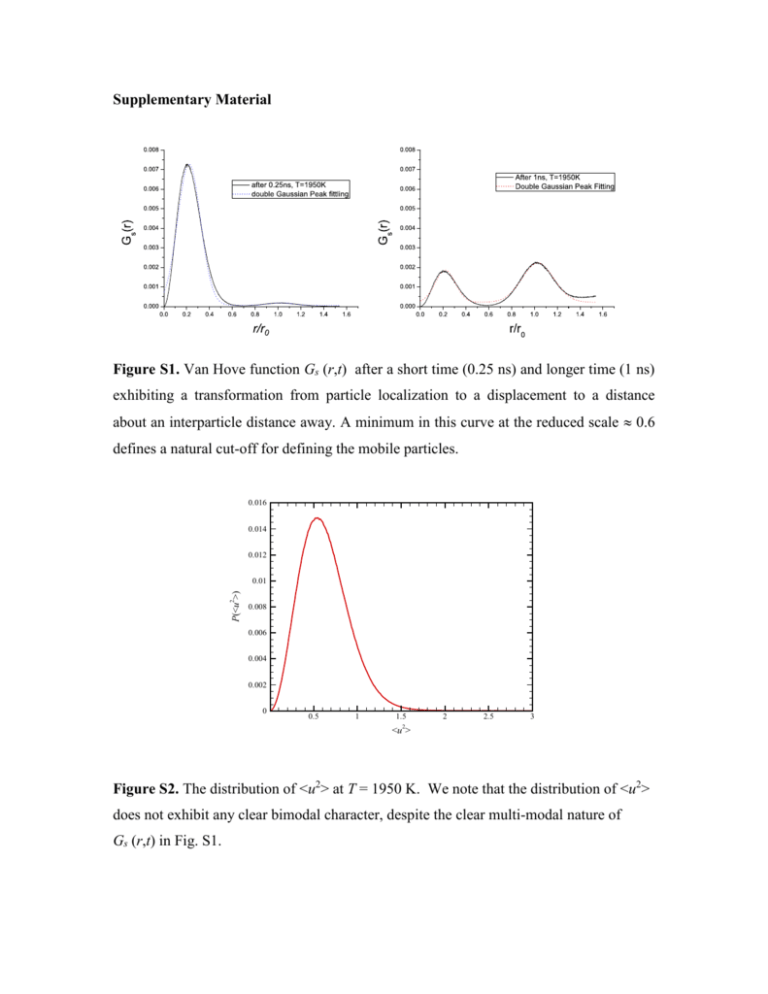
Supplementary Material Figure S1. Van Hove function Gs (r,t) after a short time (0.25 ns) and longer time (1 ns) exhibiting a transformation from particle localization to a displacement to a distance about an interparticle distance away. A minimum in this curve at the reduced scale 0.6 defines a natural cut-off for defining the mobile particles. 0.016 0.014 0.012 P(<u2>) 0.01 0.008 0.006 0.004 0.002 0 0.5 1 1.5 2 2.5 3 2 <u > Figure S2. The distribution of <u2> at T = 1950 K. We note that the distribution of <u2> does not exhibit any clear bimodal character, despite the clear multi-modal nature of Gs (r,t) in Fig. S1. Figure S3. Decay first peak height of Gs (r,t) in Fig. S1. The first peak magnitude at T = ( ) 1950 K, denoted (t), decays an exponential function, F(t) » exp -t / t , to a good approximation. The time constant fitted here is 700 ps, which is comparable to the structural relaxation time s obtained from the self-intermediate scattering function ( 800 ps; See Fig. 9 in text). The structural relaxation time then reflects the persistence time of the particles in the immobile state, as in glass-forming liquids.87 P (n) 10 T = 1950 K T = 1920 K T = 1880 K T = 1840 K -1 10-2 n-2.1 10 -3 10-4 n 50 100 150 Figure S4. The distribution of particle cluster sizes P(n) for mobile atoms at four T . The inset shows the average cluster size for mobile particles as a function of time interval at different T. The mobile atoms are identified as these particles by a threshold atomic displacement condition, 0.6r0 < ri (Dt) - ri (0) < 1.2r0 , involving the average bulk crystal interatomic spacing, r0. While changing the cut-off value alters the number of mobile particles, the statistical properties of the size distribution are insensitive to this choice. We then define a 'mobile particle cluster' as the group of neighboring particles having a separation less than 1.2 times the interatomic spacing. r0. The power-law cluster size distribution for the mobile particles in Fig. S.4 is characteristic of branched equilibrium polymers and the distribution of the mass of the mobile particles exhibits a similar exponent as observed before for heated crystals of Cu and model glass-forming liquids88 (See Nordlund et al.85). Figure S5. Scaling of mobile particle radius of gyration Rg with its average mass M, Rg ~ M where the inset shows = 1 / df as a function of T. The exponent is about 0.4, corresponding to a fractal dimension df 2.5, consistent with branched equilibrium polymers with screened excluded volume interactions, i.e., percolation clusters.84,162 Recent simulation estimates of the mobile particles in a model polymer glass-forming liquid also indicate a fractal dimension of these clusters near 2.5.88


