FINITE MATH - 8.2 Notes
advertisement
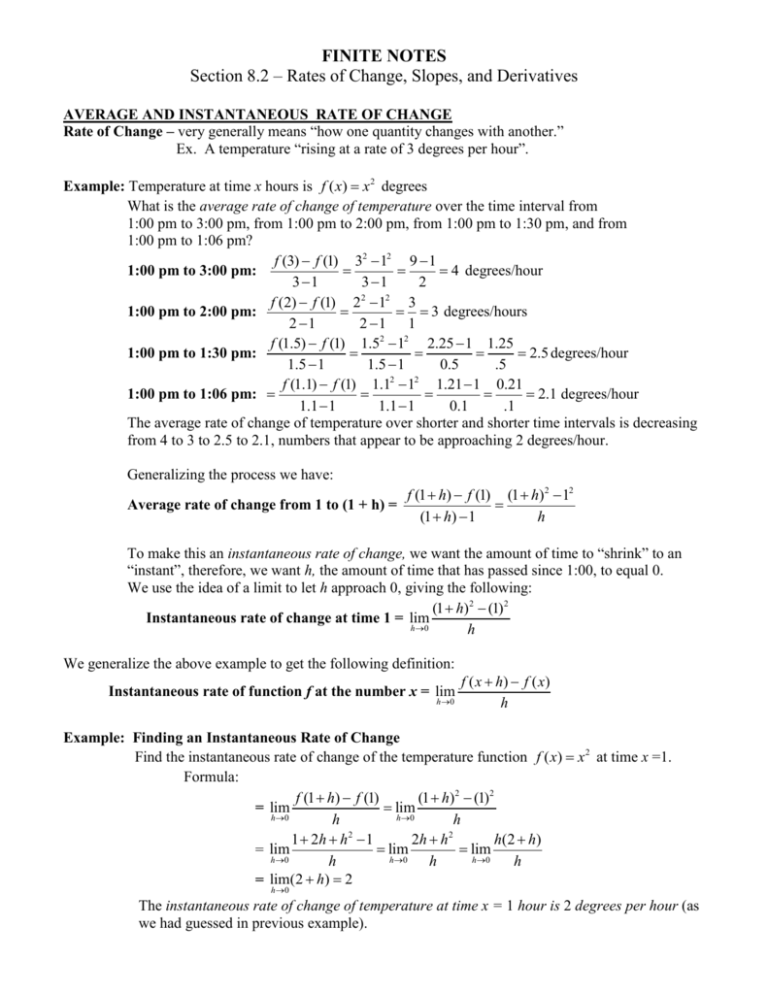
FINITE NOTES Section 8.2 – Rates of Change, Slopes, and Derivatives AVERAGE AND INSTANTANEOUS RATE OF CHANGE Rate of Change – very generally means “how one quantity changes with another.” Ex. A temperature “rising at a rate of 3 degrees per hour”. Example: Temperature at time x hours is f ( x) x 2 degrees What is the average rate of change of temperature over the time interval from 1:00 pm to 3:00 pm, from 1:00 pm to 2:00 pm, from 1:00 pm to 1:30 pm, and from 1:00 pm to 1:06 pm? f (3) f (1) 32 12 9 1 1:00 pm to 3:00 pm: 4 degrees/hour 3 1 3 1 2 f (2) f (1) 22 12 3 1:00 pm to 2:00 pm: 3 degrees/hours 2 1 2 1 1 f (1.5) f (1) 1.52 12 2.25 1 1.25 1:00 pm to 1:30 pm: 2.5 degrees/hour 1.5 1 1.5 1 0.5 .5 f (1.1) f (1) 1.12 12 1.21 1 0.21 1:00 pm to 1:06 pm: 2.1 degrees/hour 1.1 1 1.1 1 0.1 .1 The average rate of change of temperature over shorter and shorter time intervals is decreasing from 4 to 3 to 2.5 to 2.1, numbers that appear to be approaching 2 degrees/hour. Generalizing the process we have: Average rate of change from 1 to (1 + h) = f (1 h) f (1) (1 h)2 12 (1 h) 1 h To make this an instantaneous rate of change, we want the amount of time to “shrink” to an “instant”, therefore, we want h, the amount of time that has passed since 1:00, to equal 0. We use the idea of a limit to let h approach 0, giving the following: (1 h)2 (1)2 Instantaneous rate of change at time 1 = lim h 0 h We generalize the above example to get the following definition: Instantaneous rate of function f at the number x = lim h 0 f ( x h) f ( x ) h Example: Finding an Instantaneous Rate of Change Find the instantaneous rate of change of the temperature function f ( x) x 2 at time x =1. Formula: f (1 h) f (1) (1 h)2 (1)2 lim = lim h 0 h 0 h h 2 2 1 2h h 1 2h h h(2 h) lim lim = lim h 0 h 0 h 0 h h h = lim(2 h) 2 h 0 The instantaneous rate of change of temperature at time x = 1 hour is 2 degrees per hour (as we had guessed in previous example). SECANT AND TANGENT LINES Secant line to a curve – a line that passes through two points on the curve. Tangent line to a curve – a line that passes through a point of the curve and matches exactly the steepness of the curve at that point. Graph of a Curve and a Secant Line f ( x h) f ( x ) of the secant line is the average rate of change of the function. h The two points where the secant line meets the curve are separated by a distance h along the xaxis. Letting h 0 forces the second point to approach the first, causing the secant line to approach the tangent line. Applying this to the equation for the slope above gives: f ( x h) f ( x ) lim h 0 h Go to the following websites to see simulations of secant lines approaching tangent lines on a graph. http://www.calvin.edu/~rpruim/courses/m161/F01/java/SecantTangent.shtml http://www.math.umn.edu/~garrett/qy/Secant.html As can be seen, as h 0 , the secant line approaches the tangent line. The slope of the tangent line at a point x is the instantaneous rate of the function at x. We can conclude the following: The slope Instantaneous rate of change of f at x = slope of the tangent line at x= f ( x h) f ( x ) lim h 0 h Finding the Slope of a Tangent Line Example: (a) Find the slope of the tangent line to f ( x ) 1 at x 2. x (b) Use the answer to (a) to find the equation of the tangent line to f ( x ) 1 at x 2. x THE DERIVATIVE Looking back: - Found instantaneous rate of change of a function ( f ( x) x 2 at x 1 ). - Found the slope of a tangent line of a curve at a particular number or point. We will not carry out same calculation, but keep x as a variable. This allows us to obtain a new function that gives the instantaneous rate of change or the slope of the tangent line at any value of x. This new function is denoted with a prime, f '( x) (read: “f prime of x”), and is called the derivative of f at x. Definition: DERIVATIVE For a function, f, the derivative of f at x is defined as f ( x h) f ( x ) f '( x) lim (provided that the limit exists). h 0 h The derivative f ‘(x) gives the instantaneous rate of change of f at x and also the slope of the graph of f at x. In general, the units of the derivative are function units per x unit. Example: Finding the Derivative of a Function from the Definition Find the derivative of f (x) = x2 – 7x + 150. Differentiation – The process of obtaining a derivative. If the derivative of a function is defined at x, then the original function is said to be differentiable at x. USING A DERIVATIVE IN AN APPLICATION Refining crude oil into various products, such as gasoline, heating oil, and plastics, requires heating and cooling the oil at different rates. Suppose that the temperature of the oil at time x hours is f (x) = x2 – 7x + 150 degrees Fahrenheit (for 0 ≤ x ≤ 8). Find the instantaneous rate of change of temperature at times x = 6 hours and x = 2 hours and interpret the results. A positive derivative means that the original quantity is increasing, and a negative derivative means that the quantity is decreasing. Look at the graph of the function above to decide whether the answers you got for the derivatives at times x = 6 hours and x = 2 hours correspond to the slope of the tangent lines at those points. Example: Finding a Derivative from the Definition Find the derivative of f (x) = x3. LEIBNIZ’S NOTATION FOR THE DERIVATIVE There are two systems of notation for the derivative, one developed by Isaac Newton and the other by Wilhelm Leibniz. Prime Notation (Newton) Leibniz’s Notation d f '( x) f ( x) dx dy y' dx dy y Leibniz’s notation reminds us that the derivative dx is the limit of the slope x . Some functions are not differentiable (the derivative does not exist) at certain x-values. Points where the function is discontinuous, vertical, or has corners and cusps are not differentiable at these points. The slope of a function f (x) is shown by the sign of f ’(x). See http://en.wikipedia.org/wiki/File:Graph_of_sliding_derivative_line.gif for demonstration. FUNCTION AND DERIVATIVE GRAPHS To begin, we recall two basic facts about the derivative f'(x) of a function f(x): 1. The value f '(a) of f '(x) at x = a is the slope of the tangent to the graph of the function f at the point where x = a. 2. f '(x) is a function of x: the slope at a point on the graph depends on the x-coordinate of that point. The graph of the derivative function f'(x) gives us interesting information about the original function f(x). The following example shows us how to sketch the graph of f'(x) from a knowledge of the graph of f(x). Example 1 Sketching the Graph of the Derivative Let f(x) have the graph shown below. Give a rough sketch of the graph of f '(x). Solution Remember that f '(x) is the slope of the tangent at the point (x, f(x)) on the graph of f. To sketch the graph of f ', we make a table with several values of x (the corresponding points are shown on the graph) and rough estimates of the slope of the tangent f '(x). x 0 0.5 1 1.5 2 2.5 3 f'(x) 3 0 4 3 0 1 0 (Note that rough estimates are the best we can do; it is difficult to measure the slope of the tangent accurately without using a grid and a ruler, so we couldn't reasonably expect two people's estimates to agree. However, all that is asked for is a rough sketch of the derivative.) Plotting these points suggests the curve shown below. Notice that the graph f '(x) intersects the x-axis at points that correspond to the high and low points on the graph of f(x). Why is this so? Here is a more interactive example. Example 2 Graph of Derivative Let f(x) have the graph shown below. Complete the following table, giving rough estimates of the slope of the tangent f'(x) at the given values of x. x 3 2 1 0 1 2 3 f '(x) Now plot these points, and hence make a rough sketch of the graph of f '(x). Which of the following best approximates your sketch of the graph of f '(x)? (click on one) Correct. Now try the exercises.
