3 - Cross-Validation for Estimating Prediction Error 3.1 – Introduction
advertisement
Section 3 – Cross-Validation for Estimating Prediction Error (numeric response)
DSCI 425 – Supervised (Statistical) Learning
3 - Cross-Validation for Estimating Prediction Error
3.1 – Introduction to Prediction Error and Estimating It
In this section we will discuss several strategies for estimating prediction error for
predictive models where the response is numeric. These methods are commonly
collectively known as cross-validation (CV) procedures. As we have only considered
MLR at this point, we consider examples of these cross-validation strategies in the case
of MLR models. However these methods of cross-validation can be extended to any of
the methods we will examine for predicting a numeric response. They also extend to
classification problems as well with changes to the metric we use for measuring the
predictive performance.
When the response is numeric we wish to estimate how accurately our models make
predictions for future observations. As we have seen, there are different metrics that
can be used to measure and compare predictive performance of different models – the
mean squared error (MSE), the root mean squared error (RMSE), the mean absolute
error (MAE), the mean absolute percentage error (MAPE), etc. All of these can be
computed for a given situation as long as the errors are measured when making
predictions for observations/cases NOT used in the model development process.
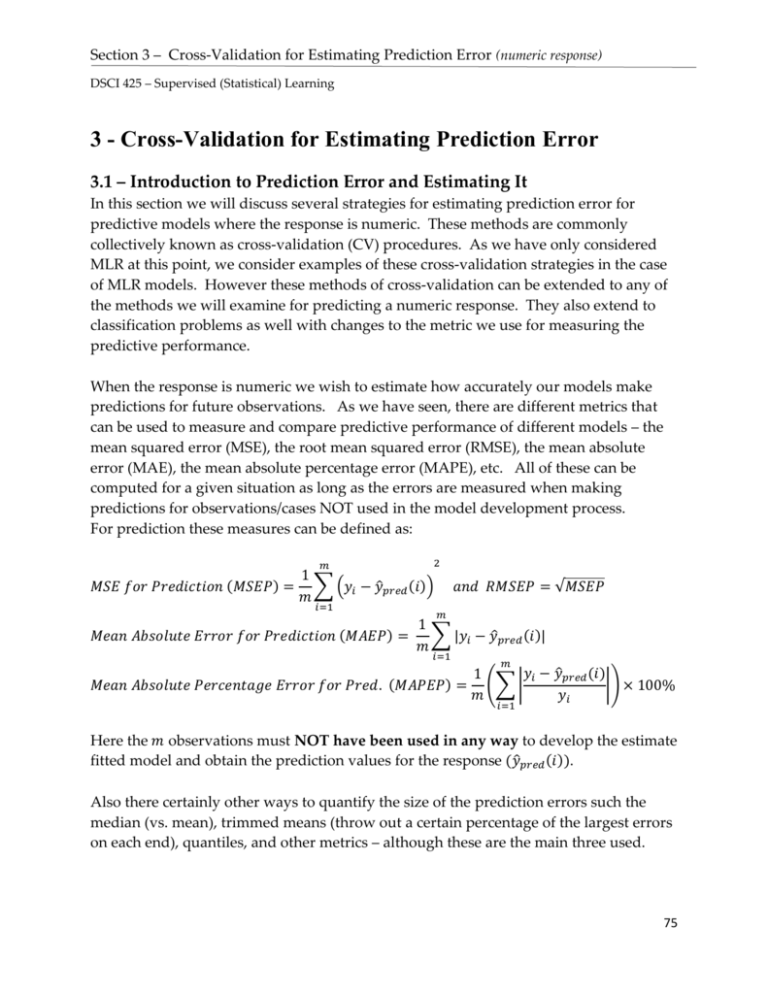
For prediction these measures can be defined as:
𝑚
2
1
𝑀𝑆𝐸 𝑓𝑜𝑟 𝑃𝑟𝑒𝑑𝑖𝑐𝑡𝑖𝑜𝑛 (𝑀𝑆𝐸𝑃) = ∑ (𝑦𝑖 − 𝑦̂𝑝𝑟𝑒𝑑 (𝑖))
𝑚
𝑖=1
𝑎𝑛𝑑 𝑅𝑀𝑆𝐸𝑃 = √𝑀𝑆𝐸𝑃
𝑚
1
𝑀𝑒𝑎𝑛 𝐴𝑏𝑠𝑜𝑙𝑢𝑡𝑒 𝐸𝑟𝑟𝑜𝑟 𝑓𝑜𝑟 𝑃𝑟𝑒𝑑𝑖𝑐𝑡𝑖𝑜𝑛 (𝑀𝐴𝐸𝑃) =
∑ |𝑦𝑖 − 𝑦̂𝑝𝑟𝑒𝑑 (𝑖)|
𝑚
𝑖=1
𝑚
𝑦𝑖 − 𝑦̂𝑝𝑟𝑒𝑑 (𝑖)
1
𝑀𝑒𝑎𝑛 𝐴𝑏𝑠𝑜𝑙𝑢𝑡𝑒 𝑃𝑒𝑟𝑐𝑒𝑛𝑡𝑎𝑔𝑒 𝐸𝑟𝑟𝑜𝑟 𝑓𝑜𝑟 𝑃𝑟𝑒𝑑. (𝑀𝐴𝑃𝐸𝑃) = (∑ |
|) × 100%
𝑚
𝑦𝑖
𝑖=1
Here the 𝑚 observations must NOT have been used in any way to develop the estimate
fitted model and obtain the prediction values for the response (𝑦̂𝑝𝑟𝑒𝑑 (𝑖)).
Also there certainly other ways to quantify the size of the prediction errors such the
median (vs. mean), trimmed means (throw out a certain percentage of the largest errors
on each end), quantiles, and other metrics – although these are the main three used.
75
Section 3 – Cross-Validation for Estimating Prediction Error (numeric response)
DSCI 425 – Supervised (Statistical) Learning
3.2 – General Idea Behind Cross-Validation Methods
As mentioned previously the goal of statistical learning models for a numeric response is to
predict the response accurately, possible at the expense of interpretability. The stepwise
methods we reviewed in MLR to some extent help identify models that may predict the
response well but the criteria (AIC, BIC, Mallow’s 𝐶𝑘 , p-values, etc.) used in model selection are
NOT considering how accurately our model will predict future values of the response.
In order to measure prediction accuracy we need to assess the ability of the model to predict the
response using observations that were not used in the model development process. The reason
why this is important is essentially the same reason why we cannot use the unadjusted 𝑅 2 in the
model development process. Every time we add a term to the model the RSS goes down and
the R-square goes up. A more complex model will always explain more variation in the
response, however that does not mean it is going to predict the response more accurately.
To measure prediction accuracy we use Cross-Validation. In cross-validation we essentially
divide our available data into disjoint sets of observations. One set of observations, called the
training set, will be used to develop and fit the model. The model developed using the training
set will then be used to predict the known response values in the other set, called the validation
set. We use the validation set to choose the model that best predicts the response values in
validation set. In order to judge the accuracy of future response predictions using the model
selected by using the training and validation sets we may to choose have a third set of
observations called the test set. The test cases are NOT used in the model development process
at all, thus the accuracy of the response predictions for the test set cases should give us a
reasonable measure of the prediction accuracy of our final model. We will see later in this
course that we often times use the validation set to fine tune the model in terms of its predictive
abilities, thus in some sense it is using the observations in the validation set for model
development purposes (even though they are NOT used to fit model). If we do not have a
large dataset we may not have enough observations to create these three sets, in which case we
may want only create the training and validation sets. The validation and test sets are also
called holdback sets as they contain observations held out in estimating the model. Most
modern regression methods have some form of internal validation built into the algorithm that
is used to “select or tune” the model.
There are different approaches one can take in forming training/validation/test sets for the
purposes of conducting the cross-validation of a model. We will examine several schemes that
are commonly employed below.
76
Section 3 – Cross-Validation for Estimating Prediction Error (numeric response)
DSCI 425 – Supervised (Statistical) Learning
3.3 - Split-Sample Cross-Validation Approaches
Split-sample approaches simply split our original sample into the disjoint sets defined
above. Splitting is usually done randomly, however we may choose to use a stratified
sampling to take other factors into account when creating our sets. For example, if one
of the variables in our data is the subject’s sex then we may want to make sure our sets
are balanced in terms of the distribution of sex. We can also stratify on a numeric
variable to make sure the distribution of this variable is roughly same in each set. For
example if we are modeling home prices, we may want to make sure each set has a
similar mixture of low and high price homes.
Training/Validation Sets Only
Training
Set
Original
Dataset
Split randomly
or stratified
(100-p)%
Validation
Set
(p%)
There is no definitive rule for the percentage of
observations assigned to each set. Some common
choices would 80/20, 75/25, 70/30, 66.6/33.4, or 60/40
(though if you are willing to use 40% of your data for
validation purposes it would be better to use
training/validation/test sets.) For multiple regression
a rule of thumb that can be used is to assign p% to the
validation set, where 𝑝% =
1
√max 𝑘
. 100% and
max 𝑘 = the largest number of parameters your model
may contain.
Training/Validation/Test Sets
Training
Set
Original
Dataset
Validation
Set
Split randomly
or stratified
Again there is no definitive rule for the percentage of
observations assigned to each set, however the most
common are 60/20/20 or 70/20/10 with the former
being the most common. Note the Test Set is in RED
because it is not used in the model development
process.
Test Set
77
Section 3 – Cross-Validation for Estimating Prediction Error (numeric response)
DSCI 425 – Supervised (Statistical) Learning
The reason the train, validation, and test set approach is used has to do with the diagram below
from Section 1. The feedback loop in the diagram below is achieved by using the validation
cases provide a measure of predictive performance for the model being fit to the training cases.
We will see that many of the algorithms have “tuning” parameters that control the complexity
of the estimated function in the “black box”. More complex models will generally fit the
training cases better (i.e. have a smaller RSS) but may not necessarily predict response value for
the validation cases better than a simpler model. Thus we can fine tune our model fit to the
training cases by considering how accurately it predicts the validation cases. Once a “final”
model has been chosen using the fitting algorithm under consideration that predicts the
validation cases most accurately we can then predict the test cases to obtain a realistic measure
of predictive performance for future observations.
Training and Validation Sets
Prediction accuracy for the validation
cases is used to provide feedback.
Test Set
Final prediction accuracy metrics (RMSEP,
MAEP, MAPEP) can be computed for
these cases to give a more realistic
measure of predictive performance.
As we will have several methods for
estimating the model (MLR, Neural
Networks, Random Forests, etc.) in our
toolbox to choose from, we can ultimately
choose the one with smallest error when
predicting the test cases.
78
Section 3 – Cross-Validation for Estimating Prediction Error (numeric response)
DSCI 425 – Supervised (Statistical) Learning
Aside:
JMP makes the process of generating these sets (either training/validation or
training/validation/test) very easy by using Cols > Modeling Utilities > Make
Validation Column option as shown below.
As you can see we have the option to make only training/validation sets or
training/validation/test sets with percentages (proportions) we choose. The default is
training/validation sets only with 75% training and 25% validation. We can also make
the set assignments randomly or by incorporating stratification variable(s).
However, as we will always have R available to use for free (hopefully), we will now
look at how you can create these sets (train/validation or train/validation/test) in R. We
saw examples of how to create train/validation sets in the previous section with some of
our MLR examples.
79
Section 3 – Cross-Validation for Estimating Prediction Error (numeric response)
DSCI 425 – Supervised (Statistical) Learning
Example 3.1 – Saratoga, NY Home Prices
In this example we will not focus on model building, but rather the split-sample approach to
cross-validation, using either train/validation or train/validation/test sets.
> names(Saratoga)
[1] "Price"
"Lot.Size"
[6] "New.Construct" "Central.Air"
[11] "Living.Area"
"Pct.College"
[16] "Rooms"
> str(Saratoga)
'data.frame': 1728
$ Price
:
122900 ...
$ Lot.Size
:
$ Waterfront
:
$ Age
:
$ Land.Value
:
$ New.Construct:
$ Central.Air :
$ Fuel.Type
:
$ Heat.Type
:
$ Sewer.Type
:
$ Living.Area :
$ Pct.College :
$ Bedrooms
:
$ Fireplaces
:
$ Bathrooms
:
$ Rooms
:
"Waterfront"
"Fuel.Type"
"Bedrooms"
"Age"
"Heat.Type"
"Fireplaces"
"Land.Value"
"Sewer.Type"
"Bathrooms"
obs. of 16 variables:
int 132500 181115 109000 155000 86060 120000 153000 170000 90000
num 0.09 0.92 0.19 0.41 0.11 0.68 0.4 1.21 0.83 1.94 ...
Factor w/ 2 levels "0","1": 1 1 1 1 1 1 1 1 1 1 ...
int 42 0 133 13 0 31 33 23 36 4 ...
int 50000 22300 7300 18700 15000 14000 23300 14600 22200 21200 ...
Factor w/ 2 levels "0","1": 1 1 1 1 2 1 1 1 1 1 ...
Factor w/ 2 levels "0","1": 1 1 1 1 2 1 1 1 1 1 ...
Factor w/ 3 levels "2","3","4": 2 1 1 1 1 1 3 3 2 1 ...
Factor w/ 3 levels "2","3","4": 3 2 2 1 1 1 2 1 3 1 ...
Factor w/ 3 levels "1","2","3": 2 2 3 2 3 2 2 2 2 1 ...
int 906 1953 1944 1944 840 1152 2752 1662 1632 1416 ...
int 35 51 51 51 51 22 51 35 51 44 ...
int 2 3 4 3 2 4 4 4 3 3 ...
int 1 0 1 1 0 1 1 1 0 0 ...
num 1 2.5 1 1.5 1 1 1.5 1.5 1.5 1.5 ...
int 5 6 8 5 3 8 8 9 8 6 ...
> dim(Saratoga) There are 𝑛 = 1728 homes available for use in developing a predictive model for price.
[1] 1728
16
> n = dim(Saratoga)[1] extract the first of the two dimensions returned by dim.
> n
[1] 1728
> n = nrow(Saratoga) this also works
Creating training and validation sets
As with most things you want to do in R, there is more than one way to skin a cat. I will
demonstrate a few of them below. The floor function truncates any decimal down to the
nearest integer value.
> train = sample(1:n,size=floor(n*.70),replace=F)
> length(train)
[1] 1209
> .70*n
[1] 1209.6
The training cases can then be referenced by using:
DATA[train,]
The validation cases can then be referenced by using: DATA[-train,]
This is the approach I used in both examples in Section 2 where we split our data into these two
sets of cases/observations.
80
Section 3 – Cross-Validation for Estimating Prediction Error (numeric response)
DSCI 425 – Supervised (Statistical) Learning
Creating training, validation, and test sets
Suppose we wish to split our data into train, validation, and test sets using approximately
60%-20%-20% of the observations in these sets respectively.
> n = nrow(Saratoga)
> m1 = floor(n*.60) or ceiling(n*.60)
> m2 = floor(n*.20) or ceiling(n*.20)
> RO = sample(1:n,size=n,replace=F) this command permutes the indices 1 – n.
> train = RO[1:m1]
> valid = RO[(m1+1):(m1+m2+1)]
> test = RO[(m1+m2+2):n]
> length(train)
[1] 1036
> length(valid)
[1] 346
> length(test)
[1] 346
> 1036+346+346
[1] 1728
The training cases can then be referenced by using:
The validation cases can then be referenced by using:
The test cases can then be referenced by using:
DATA[train,]
DATA[valid,]
DATA[test,]
Before looking at a very simple example using these three sets for the Saratoga, NY home price
data we will write a function to compute measures of predictive performance which takes the
actual response values and the predicted response values as arguments. It is important to
realize that I am a hack R programmer, so my functions are not very elegant or efficient in terms
of coding.
PredAcc = function(y,ypred){
RMSEP = sqrt(mean((y-ypred)^2))
MAE = mean(abs(y-ypred))
MAPE = mean(abs(y-ypred)/y)*100
cat("RMSEP\n")
cat("===============\n")
cat(RMSEP,"\n\n")
cat("MAE\n")
cat("===============\n")
cat(MAE,"\n\n")
cat("MAPE\n")
cat("===============\n")
cat(MAPE,"\n\n")
return(data.frame(RMSEP=RMSEP,MAE=MAE,MAPE=MAPE))
}
We now use a simple model to show how we can use the training, validation, and test sets in
development of a MLR regression model for predicting home prices using the Saratoga data.
81
Section 3 – Cross-Validation for Estimating Prediction Error (numeric response)
DSCI 425 – Supervised (Statistical) Learning
We will first fit a model using the response and all of the numeric predictors in their original
scale as well as all of the factor terms created from the nominal predictors using the training
data.
> home.lm1 = lm(Price~.,data=Saratoga[train,])
> summary(home.lm1)
Call:
lm(formula = Price ~ ., data = Saratoga[train, ])
Residuals:
Min
1Q
-219094 -34937
Median
-5129
3Q
26474
Max
463964
Coefficients:
(Intercept)
Lot.Size
Waterfront1
Age
Land.Value
New.Construct1
Central.Air1
Fuel.Type3
Fuel.Type4
Heat.Type3
Heat.Type4
Sewer.Type2
Sewer.Type3
Living.Area
Pct.College
Bedrooms
Fireplaces
Bathrooms
Rooms
--Signif. codes:
Estimate Std. Error t value Pr(>|t|)
8.971e+03 2.586e+04
0.347
0.7288
7.236e+03 3.018e+03
2.398
0.0167 *
8.579e+04 2.100e+04
4.086 4.74e-05 ***
-1.219e+02 7.511e+01 -1.622
0.1050
9.092e-01 7.208e-02 12.614 < 2e-16 ***
-5.062e+04 1.114e+04 -4.544 6.19e-06 ***
1.191e+04 4.820e+03
2.470
0.0137 *
-9.904e+03 1.745e+04 -0.567
0.5705
4.197e+03 6.783e+03
0.619
0.5363
-7.033e+03 5.698e+03 -1.234
0.2174
3.648e+03 1.781e+04
0.205
0.8377
1.532e+04 2.218e+04
0.691
0.4899
2.022e+04 2.215e+04
0.913
0.3614
7.009e+01 6.055e+00 11.576 < 2e-16 ***
-2.910e+02 2.067e+02 -1.408
0.1595
-6.052e+03 3.459e+03 -1.750
0.0805 .
6.159e+03 4.008e+03
1.537
0.1246
2.312e+04 4.534e+03
5.098 4.09e-07 ***
2.387e+03 1.299e+03
1.838
0.0663 .
0 ‘***’ 0.001 ‘**’ 0.01 ‘*’ 0.05 ‘.’ 0.1 ‘ ’ 1
Residual standard error: 61420 on 1017 degrees of freedom
Multiple R-squared: 0.6287,
Adjusted R-squared: 0.6222
F-statistic: 95.68 on 18 and 1017 DF, p-value: < 2.2e-16
We then can use our prediction accuracy function above to measure the predictive performance
of this model for the validation cases.
> y = Saratoga$Price[valid]
> ypred = predict(home.lm1,newdata=Saratoga[valid,])
> results = PredAcc(y,ypred)
RMSEP
===============
53383.7
MAE
===============
41583.18
MAPE
===============
38.10673
82
Section 3 – Cross-Validation for Estimating Prediction Error (numeric response)
DSCI 425 – Supervised (Statistical) Learning
Because we returned the prediction accuracy measures in the form of a data frame we can
assign them to an object called “results”.
> results$RMSEP
[1] 53383.7
> results$MAE
[1] 41583.18
> results$MAPE
[1] 38.10673
> results
RMSEP
MAE
MAPE
1 53383.7 41583.18 38.10673
We will now construct a simplified model using stepwise model selection to reduce the
complexity of our base model. We can then use our prediction accuracy function to compare
the two models in terms of their predictive performance on the validation cases.
> home.step = step(home.lm1)
Start: AIC=22863.65
Price ~ Lot.Size + Waterfront + Age + Land.Value + New.Construct +
Central.Air + Fuel.Type + Heat.Type + Sewer.Type + Living.Area +
Pct.College + Bedrooms + Fireplaces + Bathrooms + Rooms
- Fuel.Type
- Sewer.Type
- Heat.Type
<none>
- Pct.College
- Fireplaces
- Age
- Bedrooms
- Rooms
- Lot.Size
- Central.Air
- Waterfront
- New.Construct
- Bathrooms
- Living.Area
- Land.Value
Df Sum of Sq
RSS
AIC
2 2.7964e+09 3.8394e+12 22860
2 5.9876e+09 3.8426e+12 22861
2 5.9985e+09 3.8426e+12 22861
3.8366e+12 22864
1 7.4770e+09 3.8441e+12 22864
1 8.9111e+09 3.8455e+12 22864
1 9.9308e+09 3.8465e+12 22864
1 1.1549e+10 3.8481e+12 22865
1 1.2745e+10 3.8493e+12 22865
1 2.1686e+10 3.8583e+12 22868
1 2.3021e+10 3.8596e+12 22868
1 6.2972e+10 3.8996e+12 22879
1 7.7885e+10 3.9145e+12 22883
1 9.8044e+10 3.9346e+12 22888
1 5.0551e+11 4.3421e+12 22990
1 6.0022e+11 4.4368e+12 23012
Step: AIC=22860.41
Price ~ Lot.Size + Waterfront + Age + Land.Value + New.Construct +
Central.Air + Heat.Type + Sewer.Type + Living.Area + Pct.College +
Bedrooms + Fireplaces + Bathrooms + Rooms
- Sewer.Type
- Heat.Type
<none>
- Pct.College
- Fireplaces
- Age
- Bedrooms
- Rooms
- Central.Air
- Lot.Size
- Waterfront
- New.Construct
Df Sum of Sq
RSS
2 4.6730e+09 3.8441e+12
2 8.9420e+09 3.8483e+12
3.8394e+12
1 7.4324e+09 3.8468e+12
1 8.5136e+09 3.8479e+12
1 9.0762e+09 3.8485e+12
1 1.2039e+10 3.8514e+12
1 1.3342e+10 3.8527e+12
1 2.2550e+10 3.8619e+12
1 2.3201e+10 3.8626e+12
1 6.6401e+10 3.9058e+12
1 7.7217e+10 3.9166e+12
AIC
22858
22859
22860
22860
22861
22861
22862
22862
22865
22865
22876
22879
83
Section 3 – Cross-Validation for Estimating Prediction Error (numeric response)
DSCI 425 – Supervised (Statistical) Learning
- Bathrooms
- Living.Area
- Land.Value
1 9.5965e+10 3.9354e+12 22884
1 5.0854e+11 4.3479e+12 22987
1 5.9893e+11 4.4383e+12 23009
ETC…
> summary(home.step)
Call:
lm(formula = Price ~ Lot.Size + Waterfront + Age + Land.Value +
New.Construct + Central.Air + Living.Area + Bedrooms + Bathrooms +
Rooms, data = Saratoga[train, ])
Residuals:
Min
1Q
-218892 -34757
Median
-5124
3Q
26623
Max
464177
Coefficients:
Estimate Std. Error t value Pr(>|t|)
(Intercept)
1.007e+04 8.675e+03
1.161 0.24584
Lot.Size
6.562e+03 2.708e+03
2.423 0.01557 *
Waterfront1
9.041e+04 2.071e+04
4.365 1.40e-05 ***
Age
-1.258e+02 7.072e+01 -1.779 0.07559 .
Land.Value
9.038e-01 6.939e-02 13.025 < 2e-16 ***
New.Construct1 -4.759e+04 1.088e+04 -4.376 1.33e-05 ***
Central.Air1
1.445e+04 4.445e+03
3.252 0.00119 **
Living.Area
7.136e+01 5.846e+00 12.208 < 2e-16 ***
Bedrooms
-6.609e+03 3.387e+03 -1.952 0.05127 .
Bathrooms
2.367e+04 4.448e+03
5.321 1.27e-07 ***
Rooms
2.563e+03 1.292e+03
1.984 0.04751 *
--Signif. codes: 0 ‘***’ 0.001 ‘**’ 0.01 ‘*’ 0.05 ‘.’ 0.1 ‘ ’ 1
Residual standard error: 61400 on 1025 degrees of freedom
Multiple R-squared: 0.626,
Adjusted R-squared: 0.6224
F-statistic: 171.6 on 10 and 1025 DF, p-value: < 2.2e-16
The stepwise reduced models has 8 less terms, thus we are estimating 8 less parameters,
resulting in a simpler model than the full model. It should be case that this simpler model has
better predictive performance. To see if this is the case, we again use our validation set and
measure the predictive accuracy of this simpler model for the validation case response values.
> ypred = predict(home.step,newdata=Saratoga[valid,])
> results.step = PredAcc(y,ypred)
RMSEP
===============
53156.51
MAE
===============
41497.43
MAPE
===============
37.7876
> results
RMSEP
MAE
MAPE
1 53383.7 41583.18 38.10673
> results.step
RMSEP
MAE
MAPE
1 53156.51 41497.43 37.7876
84
Section 3 – Cross-Validation for Estimating Prediction Error (numeric response)
DSCI 425 – Supervised (Statistical) Learning
As expected, the simpler model has better predictive performance than the larger, more
complex, MLR model (though only slightly). At this point we might decide our reduced model
is the “best” MLR model we can develop for these data (which I highly doubt it is). Thus we
can get a final estimate of the predictive performance of this model for future observations by
looking at the prediction accuracy for test cases.
> ypred = predict(home.step,newdata=Saratoga[test,])
> y = Saratoga$Price[test]
> results.test = PredAcc(y,ypred)
RMSEP
===============
54355.93
MAE
===============
39999.6
MAPE
===============
21.53177
These results could now be reported as the expected predictive accuracy of our model as we
move forward estimating home selling prices in Saratoga, NY given the home characteristics
(i.e. predictor values).
It is important to note that though the model was only fit using the training cases we compared
rival models using the prediction accuracy for the validation cases. Thus the validation cases
were used in the model development process!
85
Section 3 – Cross-Validation for Estimating Prediction Error (numeric response)
DSCI 425 – Supervised (Statistical) Learning
3.4 – k-Fold Cross-Validation
Another common cross-validation method used in model development is k-fold Crossvalidation. In k-fold cross-validation the entire dataset is broken into 𝑘 roughly equal
size disjoint sets (k = 5 or 10 typically). Then 𝑘 rounds of model fitting is done where
the model is fit using (k-1) of the sets to predict the set left out with of the k-sets serving
as the validation set. The diagram below illustrates a 10-fold cross-validation (𝑘 = 10).
10-fold Cross-Validation
Using this method the model chosen is the one that has the best average or aggregate
prediction error over the 𝑘 subsets. Some of the methods we will examine in this course
have a built-in k-fold cross-validation in the model fitting process. More specifically
the “tuning” parameters in fitting the model are automatically chosen internally using
k-fold cross-validation. We still may choose to use a split-sample approach along with
the internal k-fold cross-validation however. It is difficult to do k-fold cross-validation
for a model method you are considering without writing your own function to do so.
There are functions in some packages that will k-fold cross-validation for you however.
Note: k-fold cross-validation with (𝑘 = 2) is essentially equivalent to the training/validation
split-sample approach where a 50-50% split is used.
On the following page is code for a function (kfold.MLR) that will perform k-fold crossvalidation for any MLR model where the response has NOT been transformed.
However, it could be used to compare the predictive performance of rival models
where the same response transformation has been used, e.g. for comparing MLR
models where the log transformed response is used in each.
86
Section 3 – Cross-Validation for Estimating Prediction Error (numeric response)
DSCI 425 – Supervised (Statistical) Learning
Function for performing k-fold cross-validation of a MLR regression model
kfold.MLR = function(fit,k=10) {
sum.sqerr = rep(0,k)
sum.abserr = rep(0,k)
sum.pererr = rep(0,k)
y = fit$model[,1]
x = fit$model[,-1]
data = fit$model
n = nrow(data)
folds = sample(1:k,nrow(data),replace=T)
for (i in 1:k) {
fit2 <- lm(formula(fit),data=data[folds!=i,])
ypred = predict(fit2,newdata=data[folds==i,])
sum.sqerr[i] = sum((y[folds==i]-ypred)^2)
sum.abserr[i] = sum(abs(y[folds==i]-ypred))
sum.pererr[i] = sum(abs(y[folds==i]-ypred)/y[folds==i])
}
cv = return(data.frame(RMSEP=sqrt(sum(sum.sqerr)/n),
MAE=sum(sum.abserr)/n,
MAPE=sum(sum.pererr)/n))
}
Comments on the kfold.MLR code:
I will expect by the end of this course that all of you will be able to write your own crossvalidation routines for any modeling method.
87
Section 3 – Cross-Validation for Estimating Prediction Error (numeric response)
DSCI 425 – Supervised (Statistical) Learning
Below the kfold.MLR function is used to compare the full model and the stepwise reduced
models for the Saratoga data using MLR with the response and numeric predictors in their
original scales.
> home.lm1 = lm(Price~.,data=Saratoga)
> home.step = step(home.lm1)
fit using all of the data
> results.full = kfold.MLR(home.lm1)
> results.full
RMSEP
MAE
MAPE
1 58740.44 41580.13 0.2562079
> results.step = kfold.MLR(home.step)
> results.step
RMSEP
MAE
MAPE
1 58587.15 41488.02 0.2557484
3.5 - Leave-Out-One Cross-Validation (LOOCV) and GCV Criterion
Leave-out-one cross-validation is a quick an easy way to assess prediction accuracy,
though DEFINITELY not the best! LOOCV is equivalent to 𝑘-fold cross-validation
where 𝑘 = 𝑛 (the number of observations in the data set).
Using the fact the predicted value for 𝑦𝑖 when the 𝑖 𝑡ℎ case is deleted from the MLR
model is equal to
𝑦𝑖 − 𝑦̂(𝑖) =
𝑒̂𝑖
= 𝑒̂(𝑖)
(1 − ℎ𝑖 )
Here 𝑒̂𝑖 = 𝑢𝑠𝑢𝑎𝑙 𝑖 𝑡ℎ 𝑟𝑒𝑠𝑖𝑑𝑢𝑎𝑙 and ℎ𝑖 = 𝑝𝑜𝑡𝑒𝑛𝑡𝑖𝑎𝑙 𝑜𝑟 𝑙𝑒𝑣𝑒𝑟𝑎𝑔𝑒 𝑣𝑎𝑙𝑢𝑒 𝑓𝑜𝑟 𝑡ℎ𝑒 𝑖 𝑡ℎ 𝑐𝑎𝑠𝑒.
This is also called the 𝑖 𝑡ℎ jackknife residual and the sum of these squared jackknife
residuals is called the PRESS statistic (Predicted REsidual Sum of Squares), one of the
first measures of prediction error.
𝑛
𝑃𝑅𝐸𝑆𝑆 = ∑(𝑦𝑖 − 𝑦̂(𝑖) )
2
𝑖=1
You can obtain the PRESS statistic for any fitted MLR model in R by running the
function PRESS whose code is below. Another way to do this is to run the kfold.MLR
function with 𝑘 = 𝑛.
PRESS = function(lm1){
lmi = lm.influence(lm1)
h = lmi$hat
e = resid(lm1)
PRESS = sum((e/(1-h))^2)
RMSEP = sqrt(PRESS/n)
return(data.frame(PRESS=PRESS,RMSEP=RMSEP))
}
88
Section 3 – Cross-Validation for Estimating Prediction Error (numeric response)
DSCI 425 – Supervised (Statistical) Learning
> home.lm1 = lm(Price~.,data=Saratoga)
> home.step = step(home.lm1)
again fit using all of the full dataset
> press.full = PRESS(home.lm1)
> press.step = PRESS(home.step)
> press.full
PRESS
RMSEP
1 5.964562e+12 58751.29
> press.step
PRESS
RMSEP
1 5.925972e+12 58560.93
Computing the leverage values (ℎ𝑖 = 𝑖 𝑡ℎ 𝑑𝑖𝑎𝑔𝑜𝑛𝑎𝑙 𝑒𝑙𝑒𝑚𝑒𝑛𝑡 𝑜𝑓 𝑡ℎ𝑒 𝐻𝑎𝑡 𝑚𝑎𝑡𝑟𝑖𝑥 (𝐻)) is
computationally expensive, thus a similar criterion to the PRESS statistic that is
computationally much less expensive is the Generalized Cross-Validation statistic.
𝑛
𝐺𝐶𝑉 =
2
1
𝑦𝑖 − 𝑦̂𝑖
∑(
)
𝑡𝑟(𝑯)
𝑛
1
−
𝑖=1
𝑛
This definition the GCV criterion is specific to OLS regression. In matrix notation OLS
regression is given by,
𝒀 = 𝑼𝜷 + 𝒆
where,
𝑦1
1 𝑢11
𝑦2
𝑢21
𝒀 = ( ⋮ ) , 𝑼 = (1
⋮
⋮
𝑦𝑛
1 𝑢𝑛1
⋯ 𝑢1,𝑘−1
⋯ 𝑢2,𝑘−1
),
⋱
⋮
⋯ 𝑢𝑛,𝑘−1
𝑒1
𝛽𝑜
𝑒2
𝛽1
𝜷=(
) 𝑎𝑛𝑑 𝒆 = ( ⋮ ).
⋮
𝑒𝑛
𝛽𝑘−1
𝑈𝑗 = 𝑗 𝑡ℎ 𝑡𝑒𝑟𝑚 in our regression model and the 𝑢𝑖𝑗 are the observed values of the jth term.
̂ = (𝛽̂𝑜 , 𝛽̂1 , … , 𝛽̂𝑘−1 ) are found using
As before, the OLS estimates of the parameters 𝜷
matrices as:
̂ = (𝑼𝑻 𝑼)−𝟏 𝑼𝑻 𝒀, 𝒀
̂ = 𝑯𝒀 = 𝑼(𝑼𝑻 𝑼)−𝟏 𝑼𝑻 𝒀 , 𝑎𝑛𝑑 𝒆̂ = 𝒀 − 𝒀
̂.
𝜷
Notice the predicted values (𝑌̂) are a linear combination of the observed response
values (𝑌), namely 𝑌̂ = 𝐻𝑌. This is common to several more advanced modeling
strategies we will be examining in the course.
89
Section 3 – Cross-Validation for Estimating Prediction Error (numeric response)
DSCI 425 – Supervised (Statistical) Learning
Many more flexible regression modeling methods have the following property.
̂ = 𝑺𝝀 𝒀
𝒀
This says that the fitted values from the model are obtained by taking a linear
combinations of the observed response values determined by the rows of the 𝑛 × 𝑛
matrix 𝑺𝜆 . For example, regression methods such as ridge and LASSO regression have
this form. The subscript 𝜆 represents a “tuning” parameter that controls the complexity
of the fitted model. For example in MLR the tuning parameter would essentially be the
number of terms/parameters used in the model.
̂ = 𝑺𝝀 𝒀 the GCV criterion is given
When the fitted values from the model are obtained as 𝒀
by,
𝑛
𝐺𝐶𝑉 =
2
1
𝑦𝑖 − 𝑦̂𝑖
∑(
)
𝑡𝑟(𝑺𝜆 )
𝑛
𝑖=1 1 −
𝑛
Several methods we will examine use the GCV criterion internally to choose the optimal tuning
parameter value (𝜆).
90
Section 3 – Cross-Validation for Estimating Prediction Error (numeric response)
DSCI 425 – Supervised (Statistical) Learning
3.6 - Bootstrap Estimate of Prediction Error
The bootstrap in statistics is a method for approximating the sampling distribution of a
statistic by resampling from our observed random sample. To put it simply, a bootstrap
sample is a sample of size n drawn with replacement from our original sample.
The bootstrap treats the original random sample as the estimated population (𝑃̂) and
draws repeated samples with replacement from it. For each bootstrap sample we can fit
our predictive model.
A bootstrap sample for regression (or classification) problems is illustrated below.
𝐷𝑎𝑡𝑎: (𝒙1 , 𝑦1 ), (𝒙𝟐 , 𝑦2 ), … , (𝒙𝒏 , 𝑦𝑛 ) here the 𝒙′𝒊 𝑠 are the p-dimensional predictor vectors.
𝐵𝑜𝑜𝑡𝑠𝑡𝑟𝑎𝑝 𝑆𝑎𝑚𝑝𝑙𝑒: (𝒙∗𝟏 , 𝑦1∗ ), (𝒙∗𝟐 , 𝑦2∗ ), … , (𝒙∗𝒏 , 𝑦𝑛∗ ) where (𝒙∗𝒊 , 𝑦𝑖∗ ) is a random selected
observation from the original data drawn with replacement.
We can use the bootstrap sample to calculate any statistic of interest. This process is
then repeated a large number of times (B = 500, 1000, 5000, etc.).
For estimating prediction error we fit whatever model we are considering to our
bootstrap sample and use it to predict the response value for observations not selected
in our bootstrap sample. One can show that about 63.2% of the original observations
will represented in the bootstrap sample and about 36.8% of the original observations
will not be selected. Can you show this? Thus we will almost certainly have some
observations that are not represented in our bootstrap sample to serve as a validation
set, with the selected observations in our bootstrap sample serving as our training set.
91
Section 3 – Cross-Validation for Estimating Prediction Error (numeric response)
DSCI 425 – Supervised (Statistical) Learning
For each bootstrap sample we can predict the response for the cases in the validation set
(i.e. indices for observations not represented in our bootstrap sample).
Estimating the prediction error via the .632 Bootstrap
Again for a numeric response our goal is to estimate the root mean prediction squared
error (RMSEP) to compare rival models. Another alternative to the cross-validation
methods presented above is to use the .632 bootstrap for estimating the PSE.
The algorithm for the .632 bootstrap is given below:
1) First calculate the average squared residual (ASR) from your model
ASR = 𝑅𝑆𝑆/𝑛.
2) Take B bootstrap samples drawn with replacement, i.e. we draw a sample with
replacement from the numbers 1 to n and use the cases/observations as our “new
data”.
3) Fit the model to each of the B bootstrap samples, computing the 𝐴𝑆𝑅(𝑗) from
predicting the observations not represented in the bootstrap sample.
Here 𝐴𝑆𝑅(𝑗) = average squared residual for prediction in the 𝑗 𝑡ℎ bootstrap
sample, 𝑗 = 1, … , 𝐵.
4) Compute ASR0 = the average of the bootstrap 𝐴𝑆𝑅(𝑗) values
5) Compute the optimism (𝑂𝑃), 𝑂𝑃 = .632 ∗ (𝐴𝑆𝑅0 – 𝐴𝑆𝑅).
6) The .632 bootstrap estimate of 𝑅𝑀𝑆𝐸𝑃 = √𝐴𝑆𝑅 + 𝑂𝑃.
The bootstrap approach has been shown to be better than K-fold cross-validation in many cases.
Here is a function for finding the .632 bootstrap estimate of the RMSEP given a MLR model fit
using the lm function.
bootols.cv = function(fit,B=100) {
yact=fit$fitted.values+fit$residuals
ASR=mean(fit$residuals^2)
AAR=mean(abs(fit$residuals))
APE=mean(abs(fit$residuals)/yact)
boot.sqerr=rep(0,B)
boot.abserr=rep(0,B)
boot.perr=rep(0,B)
y = fit$model[,1]
x = fit$model[,-1]
data = fit$model
n = nrow(data)
for (i in 1:B) {
sam=sample(1:n,n,replace=T)
samind=sort(unique(sam))
temp=lm(formula(fit),data=data[sam,])
ypred=predict(temp,newdata=data[-samind,])
boot.sqerr[i]=mean((y[-samind]-ypred)^2)
boot.abserr[i]=mean(abs(y[-samind]-ypred))
boot.perr[i]=mean(abs(y[-samind]-ypred)/y[-samind])
}
92
Section 3 – Cross-Validation for Estimating Prediction Error (numeric response)
DSCI 425 – Supervised (Statistical) Learning
ASRo=mean(boot.sqerr)
AARo=mean(boot.abserr)
APEo=mean(boot.perr)
OPsq=.632*(ASRo-ASR)
OPab=.632*(AARo-AAR)
OPpe=.632*(APEo-APE)
RMSEP=sqrt(ASR+OPsq)
MAEP=AAR+OPab
MAPEP=APE+OPpe
cat("RMSEP\n")
cat("===============\n")
cat(RMSEP,"\n\n")
cat("MAE\n")
cat("===============\n")
cat(MAEP,"\n\n")
cat("MAPE\n")
cat("===============\n")
cat(MAPEP,"\n\n")
return(data.frame(RMSEP=RMSEP,MAE=MAEP,MAPE=MAPEP))
}
Again we perform cross-validation on the full MLR model for the Saratoga, NY home
prices using all numeric variables in the original scales.
> home.lm1 = lm(Price~.,data=Saratoga)
> results.boot = bootols.cv(home.lm1,B=100)
RMSEP
===============
58873.29
MAE
===============
41630.37
MAPE
===============
0.2617831
> results.boot = bootols.cv(home.lm1,B=100)
RMSEP
===============
58392.04
As different bootstrap samples
are drawn each time, the results
will vary some from run-to-run.
As 𝐵 increases however, the
variability in the estimates of
RMSEP, MAE, and MAPE from
run-to-run will decrease.
MAE
===============
41455.67
MAPE
===============
0.2583147
93
Section 3 – Cross-Validation for Estimating Prediction Error (numeric response)
DSCI 425 – Supervised (Statistical) Learning
> results.boot = bootols.cv(home.lm1,B=1000) increasing the # of bootstrap samples (B = 1000)
RMSEP
===============
58726.64
MAE
===============
41620
MAPE
===============
0.2559745
> results.boot = bootols.cv(home.lm1,B=5000) increasing the # of bootstrap samples (B = 5000)
(takes a quite a while, approximately 1 minute)
RMSEP
===============
58705.25
MAE
===============
41591.98
MAPE
===============
0.2564237
If response transformations are used the code would need to altered so that the predictive
performance measures are computed in the original scale. For example if we log transform the
response the function would be:
bootlog.cv = function(fit,B=100) {
yt=fit$fitted.values+fit$residuals
yact = exp(yt)
yhat = exp(fit$fitted.values)
resids = yact - yhat
ASR=mean(resids^2)
AAR=mean(abs(resids))
APE=mean(abs(resids)/yact)
boot.sqerr=rep(0,B)
boot.abserr=rep(0,B)
boot.perr=rep(0,B)
y = fit$model[,1]
x = fit$model[,-1]
data = fit$model
n = nrow(data)
for (i in 1:B) {
sam=sample(1:n,n,replace=T)
samind=sort(unique(sam))
temp=lm(formula(fit),data=data[sam,])
ytp=predict(temp,newdata=data[-samind,])
ypred = exp(ytp)
boot.sqerr[i]=mean((exp(y[-samind])-ypred)^2)
94
Section 3 – Cross-Validation for Estimating Prediction Error (numeric response)
DSCI 425 – Supervised (Statistical) Learning
boot.abserr[i]=mean(abs(exp(y[-samind])-ypred))
boot.perr[i]=mean(abs(exp(y[-samind])-ypred)/exp(y[-samind]))
}
ASRo=mean(boot.sqerr)
AARo=mean(boot.abserr)
APEo=mean(boot.perr)
OPsq=.632*(ASRo-ASR)
OPab=.632*(AARo-AAR)
OPpe=.632*(APEo-APE)
RMSEP=sqrt(ASR+OPsq)
MAEP=AAR+OPab
MAPEP=APE+OPpe
cat("RMSEP\n")
cat("===============\n")
cat(RMSEP,"\n\n")
cat("MAE\n")
cat("===============\n")
cat(MAEP,"\n\n")
cat("MAPE\n")
cat("===============\n")
cat(MAPEP,"\n\n")
return(data.frame(RMSEP=RMSEP,MAE=MAEP,MAPE=MAPEP))
}
> log.lm1 = lm(Price~.,data=SaratogaTrans) model fit using log(Price) as the response
and some of the predictors transformed
(see examples from Section 2)
> results = bootlog.cv(log.lm1,B=100)
RMSEP
===============
61337.27
MAE
===============
41569.84
MAPE
===============
0.2430109
> results = bootlog.cv(log.lm1,B=1000)
RMSEP
===============
61061.89
MAE
===============
41508.23
MAPE
===============
0.244127
95
Section 3 – Cross-Validation for Estimating Prediction Error (numeric response)
DSCI 425 – Supervised (Statistical) Learning
> results = bootlog.cv(log.lm1,B=5000)
RMSEP
===============
61231.9
MAE
===============
41563.3
MAPE
===============
0.2448597
The model using the log transformed
response and terms based on predictor
transformations outperforms the model fit
to these data in the original scale in terms
the MAPE (as expected) but also in terms
of MAE, though only slightly.
There have been some recent improvements in the .632 bootstrap procedure, called the .632+
bootstrap which is primarily used for classification problems vs. regression problems. The
package sortinghat has functions for calculating the .632+ bootstrap for classification models.
3.7 – Monte Carlo Cross-validation (MCCV)
As noted in the previous section the results from the .632 bootstrap will vary from run-to-run,
particularly when the number of bootstrap samples (𝐵) is smaller. This also happens when
using split-sample and k-fold cross-validation methods. Using split-sample cross-validation
(either training/validation or training/validation/test sets) can lead produce very different
results depending which observations in our original data end up in these disjoint sets. The
same is true for k-fold cross-validation. The results will vary depending on which observations
fall into each of the 𝑘 folds/subsets. In general, the variability from one CV to another,
regardless of the method, will increase as the number of observations in the original data set (𝑛)
decreases. The example below illustrates this phenomenon for 10-fold CV applied to the
Saratoga, NY home prices data.
> results = kfold.MLR(home.lm1)
RMSEP
===============
58765.42
MAEP
===============
41542.15
MAPEP
===============
0.2564174
> results = kfold.MLR(home.lm1)
RMSEP
===============
58993.49
MAEP
===============
41794.73
MAPEP
===============
0.2568648
96
Section 3 – Cross-Validation for Estimating Prediction Error (numeric response)
DSCI 425 – Supervised (Statistical) Learning
> results = kfold.MLR(home.lm1)
RMSEP
===============
58657.76
MAEP
===============
41530.58
MAPEP
===============
0.2557584
> results = kfold.MLR(home.lm1)
RMSEP
===============
58697.33
MAEP
===============
41543.52
MAPEP
===============
0.2555822
ETC…
Results from split-sample approaches are even more variable. The function (MLR.ssmc) below
will perform repeated (𝑀, times) split-sample cross-validations using training/validation sets.
The fraction in the training set is determined by the argument (𝑝 = .667 𝑜𝑟 𝑡𝑤𝑜 −
𝑡ℎ𝑖𝑟𝑑𝑠 𝑏𝑦 𝑑𝑒𝑓𝑎𝑢𝑙𝑡) which can certainly be changed.
Function to perform Split-Sample Monte Carlo (ssmc) cross-validation for MLR
MLR.ssmc = function(fit,p=.667,M=100) {
RMSEP = rep(0,M)
MAEP = rep(0,M)
MAPEP = rep(0,M)
y = fit$model[,1]
x = fit$model[,-1]
data = fit$model
n = nrow(data)
for (i in 1:M) {
ss = floor(n*p)
sam = sample(1:n,ss,replace=F)
fit2 = lm(formula(fit),data=data[sam,])
ypred = predict(fit2,newdata=x[-sam,])
RMSEP[i] = sqrt(mean((y[-sam]-ypred)^2))
MAEP[i] = mean(abs(y[-sam]-ypred))
MAPEP[i]=mean(abs(y[-sam]-ypred)/y[-sam])
}
cv = return(data.frame(RMSEP=RMSEP,MAEP=MAEP,MAPEP=MAPEP))
}
97
Section 3 – Cross-Validation for Estimating Prediction Error (numeric response)
DSCI 425 – Supervised (Statistical) Learning
To see the variability from one split-sample to the next we can run this function with (𝑀 = 1).
> MLR.ssmc(home.lm1,M=1)
RMSEP
MAEP
MAPEP
1 57465.56 41476.97 0.2386411
> MLR.ssmc(home.lm1,M=1)
RMSEP
MAEP
MAPEP
1 64775.52 43779.2 0.3115381
> MLR.ssmc(home.lm1,M=1)
RMSEP
MAEP
MAPEP
1 58319.74 41420.09 0.3392159
> MLR.ssmc(home.lm1,M=1)
RMSEP
MAEP
MAPEP
1 58929.07 42660.12 0.2914981
> MLR.ssmc(home.lm1,M=1)
RMSEP
MAEP
MAPEP
1 60508.61 42360.72 0.2546718
Here we can see the all three measures of predictive performance vary fairly substantially from
one split-sample CV to the next. We can better see this by increasing M and examining the
distribution of each predictive measure.
> results = MLR.ssmc(home.lm1,M=1000)
> Statplot(results$RMSEP)
98
Section 3 – Cross-Validation for Estimating Prediction Error (numeric response)
DSCI 425 – Supervised (Statistical) Learning
> Statplot(results$MAEP)
> Statplot(results$MAPEP)
The bimodal appearance of the mean percent error for prediction (MAPEP) is interesting. It
suggests to me that depending which if certain observations end up in the validation set the
percent error is greatly increased (over 5-percentage point increase).
Summary statistics for the predictive measures over all 𝑀 = 1000 split-sample crossvalidations are presented below.
> summary(results)
RMSEP
MAEP
Min.
:50498
Min.
:37782
1st Qu.:56852
1st Qu.:40828
Median :58804
Median :41746
Mean
:58817
Mean
:41771
3rd Qu.:60733
3rd Qu.:42735
Max.
:69219
Max.
:46297
MAPEP
Min.
:0.1970
1st Qu.:0.2238
Median :0.2390
Mean
:0.2551
3rd Qu.:0.2970
Max.
:0.3535
99
Section 3 – Cross-Validation for Estimating Prediction Error (numeric response)
DSCI 425 – Supervised (Statistical) Learning
To get an accurate measure of predictive performance using k-fold CV, and particularly splitsample approaches, simulation studies have shown that Monte Carlo CV (i.e. random restarts of
these CV methods) is recommended as there is inherent variation due to the random allocation
of observations to the different subsets. Also note some literature refers MCCV as the Monte
Carlo approach applied to split-sample CV only, although I would argue the MC approach
could be applied to any form of cross-validation where random assignment of observations to
subsets is used.
In summary, the methods of Cross-Validation we have discussed are as follows:
1) Split-Sample Cross-Validation - using either training/validation or
training/validation/test sets.
2) k-fold Cross-Validation - again k = 5 or 10 are typically used.
3) Leave-Out-One CV (LOOCV) and Generalized CV (GCV)
4) .632 Bootstrap (i.e. resampling methods)
5) Monte Carlo Cross-Validation (MCCV) – which can/should be applied to splitsample and k-fold methods.
Rather than consider more examples at this point we will move on to more methods for
estimating 𝑓(𝑿) = 𝑓(𝑋1 , 𝑋2 , … , 𝑋𝑝 ). Cross-validation will be continually used throughout the
course to fine-tune our models and choose between competing modeling approaches.
Cross-Validation methods are used
for this purpose!
100
Section 3 – Cross-Validation for Estimating Prediction Error (numeric response)
DSCI 425 – Supervised (Statistical) Learning
More on Prediction Error and the Variance-Bias Tradeoff and the Role of CV
For any regression problem we assume that the response has the following model:
𝑌 = 𝑓(𝑿) + 𝜀
where 𝑿 = 𝑐𝑜𝑙𝑙𝑒𝑐𝑡𝑖𝑜𝑛 𝑜𝑓 𝑝 𝑝𝑟𝑒𝑑𝑖𝑐𝑡𝑜𝑟𝑠 = (𝑋1 , 𝑋2 , … , 𝑋𝑝 ) and 𝑉𝑎𝑟(𝜀) = 𝜎 2 .
Our goal in modeling is to approximate or estimate 𝑓(𝑿) using a random sample of size n from
the population: (𝒙1 , 𝑦1 ), (𝒙𝟐 , 𝑦2 ), … , (𝒙𝒏 , 𝑦𝑛 ) where the 𝒙′𝒊 𝑠 are the observed values of the pdimensional predictor vectors and the 𝑦𝑖 ′𝑠 are the corresponding observed values of the
response.
2
2
2
𝑀𝑆𝐸𝑃(𝑌) = 𝑀𝑆𝐸𝑃(𝑓(𝑿)) = 𝐸 [(𝑌 − 𝑓̂(𝒙)) ] = [𝐸(𝑓̂(𝒙)) − 𝑓(𝒙)] +𝐸 [(𝑓(𝒙) − 𝐸 (𝑓̂(𝒙)) ] + 𝜎 2
= 𝐵𝑖𝑎𝑠 2 (𝑓̂(𝑿)) + 𝑉𝑎𝑟 (𝑓̂(𝒙)) + 𝐼𝑟𝑟𝑒𝑑𝑢𝑐𝑖𝑏𝑙𝑒 𝐸𝑟𝑟𝑜𝑟
The cross-validation methods discussed above are all acceptable ways to estimate 𝑀𝑆𝐸𝑃(𝑌), but
some are certainly better than others. This is still an active area of research and there is no
definitive best method for every situation. Some methods are better at estimating the variance
component of the 𝑀𝑆𝐸𝑃 while others are better at estimating the bias. Ideally we would like to
use a method of cross-validation that does a reasonable job of estimating each component.
In the sections that follow we will be introducing alternatives to OLS or variations of OLS for
developing models to estimate 𝑓(𝒙). Some of these modeling strategies have the potential to be
very flexible (i.e. have small bias) but potentially at the expense of being highly variable, i.e.
have large variation, 𝑉𝑎𝑟(𝑓̂(𝒙)). Balancing these two components of squared prediction error is
critical and cross-validation is one of the main tools we will use to create this balance in our
model development process.
Validation or
Test Sample
The figure is taken from pg. 194 of The Elements of
Statistical Learning by Hastie, Tibshirani and
Friedman.
101
