z2p003153480so1 - American Psychological Association
advertisement
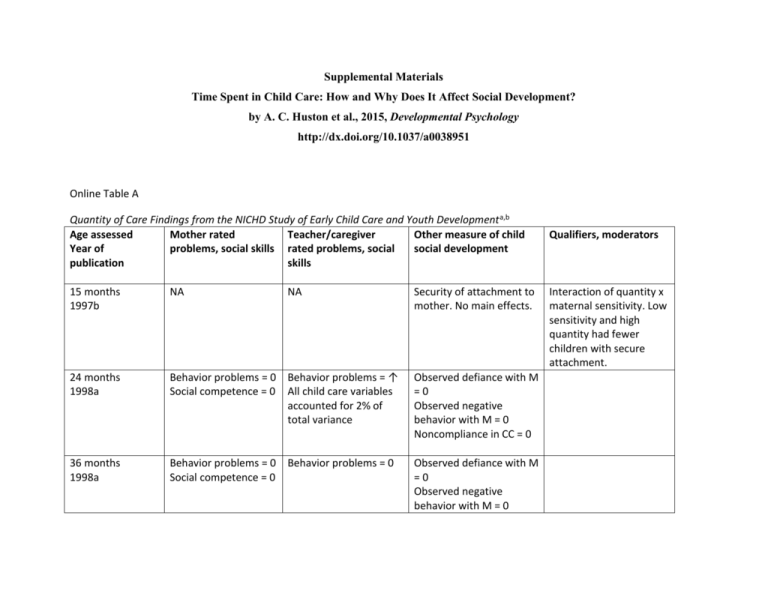
Supplemental Materials Time Spent in Child Care: How and Why Does It Affect Social Development? by A. C. Huston et al., 2015, Developmental Psychology http://dx.doi.org/10.1037/a0038951 Online Table A Quantity of Care Findings from the NICHD Study of Early Child Care and Youth Development a,b Age assessed Mother rated Teacher/caregiver Other measure of child Year of problems, social skills rated problems, social social development publication skills 15 months 1997b NA NA 24 months 1998a Behavior problems = 0 Behavior problems = ↑ Social competence = 0 All child care variables accounted for 2% of total variance Observed defiance with M =0 Observed negative behavior with M = 0 Noncompliance in CC = 0 36 months 1998a Behavior problems = 0 Social competence = 0 Observed defiance with M =0 Observed negative behavior with M = 0 Behavior problems = 0 Security of attachment to mother. No main effects. Qualifiers, moderators Interaction of quantity x maternal sensitivity. Low sensitivity and high quantity had fewer children with secure attachment. 36 months 2001b NA NA Attachment to mother. No main effects of quantity. 24 months 2001a Peer interactions Positive sociability = 0 Negative/aggression = 0 Positive sociability = 0 Negative/aggression = ↑ 24 mo = .11 36 mo = .04 Observed play in child care Positive = 0 Negative = 0 36 months 2001a Peer interactions Positive sociability = 0 Negative/aggression = 0 Positive sociability = 0 Negative/aggression = 0 Care 6-24 months Outcome 6-36 months. 1999 Mother-child interaction NA NA Observed play in child care Positive = 0 Negative = 0 Observed dyadic play: Peer skill = 0 Peer aggression = 0 Self assertion = 0 Observed mother-child interaction: Mother sensitivity = ↓ (without quality in model) Mother sensitivity = 0 (with quality included; smaller sample)b Interaction of quantity x maternal sensitivity. Low sensitivity and high quantity had higher % insecure, inhibited children. High sensitivity and high quantity had higher % secure children. Child engagement = ↓ Care 0-3 years Outcome: 36 months -1st grade 2003c Mother-child interaction NA NA Observation of motherchild interaction at 36, 54, 1st grade Maternal sensitivity = 0 Child engagement = 0 4.5 yr. 2002 & 2003a Social competence = ↓ r = -.08 Externalizing = 0 Social competence ↓ r = -.12 Externalizing ↑ r = .20 Caregiver conflict ↑ r = .16 Observed in child care: Positive = 0 Negative = 0 Dyadic play Positive = 0 Negative = 0 24, 36, 54 months 2006 Social skills = 0 Behavior problems = 0 K 2003a Social competence = 0 Externalizing = ↑ 54 months - 3rd Social skill = 0 Social skills = 0 Behavior problems 24 mo = 0 36 mo ↑ r = .09 54 mo ↑ r = .14 Conflict with teacher 54 mo ↑ r = .13 Social competence = 0 Externalizing ↑ r = .08 Caregiver conflictt ↑ r = .08 Social skill = ↓ NA Interaction of ethnic group x quantity (sensitivity and engagement): White non-Hisp = ↓ Non-white = ↑ Interaction of quantity x time (mother sensitivity only): Sensitivity at 3 yr = ↓ Sensitivity later = 0 Age x quantity grade 2005b Externalizing = 0 Conflict = 0 Externalizing = ↑ Conflict = ↑ Social emotional wellbeing = 0 54 months.-6th grade Belsky et al., 2007 NA Social skill = 0 Externalizing = 0 Conflict = 0 Social emotional wellbeing = 0 NA 9th grade Vandell et al., NA NA Self-reports: Risk taking d = .09 interaction for externalizing and conflict. With age, association of quantity with externalizing and teacher conflict declined to nonsignificant levels. Externalizing: 4.5 = .12, 1st = .08, 3rd = .03 Conflict: 4.5 = .11, 1st = .07, 3rd = .05 Age x quantity interaction for externalizing and conflict. With age, association of quantity with externalizing and teacher conflict declined to nonsignificant levels. Externalizing: 4.5 r = .11, 1st r = .07, 3rd r = .03; 6th r = -.03 Conflict: 4.5 r = .12, 1st r = .11, 3rd r = .05, 6th r = -.02 2010 Impulsivity d = .13 Externalizing 0 a. Relations of cumulative quantity to child social behavior. Quantity is defined as average hours/week from 4 months of age to age of assessment. All analyses include all children remaining in the sample at time of assessment b. Where available, effect sizes are given for significant main effects. Except where noted, they are partial correlations of hours in care with the outcome, controlling for other variables in the model. They indicate in standard deviation units how much increase in the outcome is expected for an increase of one standard deviation in the predictor. In one study, d is the effect size, indicating the predicted mean difference between youth with high (30+) and low (<10) amounts of child care experience. c. The sample with quality in the analysis was restricted to children who were observed in child care. The sample without quality was larger because it included all children. Key: ↑ = positive coefficient for the association of quantity with dependent variable, p < .05. 0 = no significant association of quantity with dependent variable. ↓ = negative coefficient for the association of quantity with dependent variable, p < .05. Online Table B Relations of Cumulative Experience in Center or Large Group Care to Child Social Behavior in NICHD Studya Predictor Mother rated Teacher/caregiver Other measure of child Qualifiers, moderators Age assessed problems, social skills rated problems, social social development Year of skills publication In settings with 2 or more other children 24 months 1998a Behavior problems = 0 Social competence = 0 Behavior problems = ↑ Observed defiance with M =0 Observed negative behavior with M = 0 Noncompliance in CC = ↑ In settings with 2 or more other children 36 months 1998a Peer availability 24 months 2001a Behavior problems = 0 Social competence = 0 Behavior problems = ↑ Observed defiance with M =0 Observed negative behavior with M = 0 Positive sociability = 0 Negative/aggression = 0 Positive sociability = 0 Negative/aggression = ↑ r = .09 Observed play in child care Positive = 0 Negative = 0 Peer availability 36 months 2001a Positive sociability = 0 Negative/aggression = 0 Positive sociability = 0 Negative/aggression = 0 Observed play in child care Positive = ↑r = .15 Negative = 0 Observed dyadic play: Peer skill = 0 Peer aggression = 0 Self assertion = 0 Hours in center care ages 1-54 months Outcome: 54 months 2004 Percent of epochs in center care 4.5 yr. 2002b No center care vs. some (24, 36) or vs. >33% of epochs in center (54 months) 2006 Social skill = 0 Externalizing = 0 Internalizing =0 Social skill = 0 Externalizing = ↑ Internalizing =0 Social skill= 0 Behavior problems = 0 Social skill = 0 Behavior problems = ↑ Social skill= 0 Behavior problems = 0 Percent of epochs in center care Kindergarten 2003a Percent of epochs in center care 54 months.- 3rd grade 2005b Behavior Problems = 0 Social skill 24 ↓ d = -.28 36 ↓ d = -.18 54 = 0 Behavior problems 24 = 0 36 = ↑ d = .20 54 = ↑ d = .14 Behavior Problems = ↑ Conflict = ↑ Social skill = 0 Externalizing = 0 Conflict = ↑ rs from age 4.5 to 3rd = .08 to .05 Social skill = 0 Externalizing = ↑ rs from age 4.5 to 3rd = ..11 to .05 Conflict = ↑ Social emotional wellbeing = 0 Positive with friend 54 mo ↑ d = .21 Negative with friend = 0 Age x center interaction for teacher conflict. With age, association of centers with teacher conflict declines 4.5 r = .13 1st r = .09 3rd r = .01 Percent of epochs in center care 54 months.-6th grade Belsky et al., 2007 NA 9th grade Vandell et al., 2010 NA Social skill = 0 Externalizing = ↑ rs from age 4.5 to 6th = ..12 to .08 Conflict = 0 Social emotional wellbeing = 0 NA Self-reports: Risk taking 0 Impulsivity 0 Externalizing 0 a. All predictors are cumulative from 6 months to time of assessment. b. Where available, effect sizes are given for significant main effects. Except where noted, they are partial correlations of hours in care with the outcome, controlling for other variables in the model. They indicate in standard deviation units how much increase in the outcome is expected for an increase of one standard deviation in the predictor. In the 2006 study, d is the effect size, indicating the predicted mean difference between children with no center experience and those with some experience or, at 54 months, more than 33% of the time in center care. Key: ↑ = positive coefficient for the association of quantity with dependent variable, p < .05 0 = no significant association of quantity with dependent variable. ↓ = negative coefficient for the association of quantity with dependent variable, p < .05. Online Table C Summary of Longitudinal Studies Examining Quantity of Care and Social Behavior Study Age Assessed Baker, Gruber, & 2-3 years old Mulligan, 2008 Barnes, Leach, Malmberg, Stein, & Sylva 2010 Bates, Marvinney, Kelly, Dodge, Bennett, & Pettit, 1994 Borge, Rutter, Côté, & Tremblay, 2004 36 months old Kindergarten Age of Child Care Experience Quantity Definition Not specified Availability of inexpensive child care 3, 10, 18, 36 months old Average hours in any type of child care between 0-36 months 0-1, 1-4, 4-5 years old Time in any type of child care calculated for each of 3 “eras” Negative adjustment = ↑, σ2 explained = 2.9% Multiple Positive adjustment =↓ σ2 explained = 2.9% US; mixed SES; 3 sites N = 580 Any care vs. mother Person most Physical aggression = knowledgeable 0 (PMK) Canada (Random NLSCY sample); mixed SES; N = 3431 Cumulative hours Behavior problems = 0 US; mixed SES 24-47 months Concurrent old Bornstein, Hahn, Gist, & Haynes, 4 ½ years old 2006 Any prior experience Type of Behavior and Direction of Effect Hyperactive = 0 Anxiety = ↑ Separation anxiety = 0 Aggression = ↑ Disruptive = 0 Expressive = ↑ for 19-36 months Compliance = 0 Reporter Sample Mother Canada N about 14,500 Mother UK; N = 1000+ Teacher Coley, VotrubaDrzal, Miller, & Koury, 2013 Côté, Borge, Geoffroy, Rutter, & Tremblay, 2008 Crosby, Dowsett, Gennetian, & Huston, 2010 Jaffee, Van Hulle, & Rodgers, 2011 Kindergarten 4 years old 5-7 years old 5-7 and 11-13 years old Age 4 full-time vs. none predicts Parent: Externalizing = ↑ D = .16 9 months, 2 None, 5-25 Learning years, 4 years hours; >25 behavior = 0 old hours/week Teacher: Externalizing = ↑ d = .26 Learning behavior = ↑ d = .18 Physical aggression Lo risk ↑d = .16 0-1 year old in Any care vs Hi risk ↓d = -.17 1994 mother Emotional problems Girls in lo risk = ↑ d = ..44 Externalizing = ↑ Center, home, (using OLS) 3-4 years old both, or neither Externalizing = ↓ (using IV) OLS (entered care between 0-1) Conduct Problems 0-1, 1-3, none ↓ d = -.12 before 3 years Any care Oppositional old Behaviors = ↓ d = -.08 Fixed effects: Parent Teacher US (ECLS-B); nationally representative born in 2001. N = 6.000 parent report; 4500 teacher report PMK Canada (Random NLSCY Sample); mixed SES N = 1358 Mother US; Low SES N=3290 N for Teacher ratings = 379 Mother US (NLSY Child Sample); Mixed SES; N=9185 Siblings N = 2700+ families Oppositional Behaviors = 0 Entered care age 23: Adolescent Conduct Problems = ↑d = .08 Lekhal, 2012 Loeb, Bridges, Bassok, Fuller, & Rumberger, 2007 Magnuson, , Ruhm, & Waldfogel, 2007 3 years old Kindergarten Kindergarten and 1st grade 1, 2, and 3 years old Age at entry into either center care or family day care 4 (Pre-K) Center, Head Start, other nonparent, parent; Age of entry by yr.; Moderate vs. high intensity (centers) Year prior to Kindergarten Externalizing & internalizing behaviors = 0 Aggregate variable including selfcontrol, interpersonal skills, and externalizing = ↑ d = -.089 (center) and d = -.12 (Head Start) Mother Norway; populationbased Mother and Child Cohort Study N=73,068 Teacher US (ECLS-K); Nationallyrepresentative; N = 14,162 children who entered Kindergarten in 1998 Teacher US (ECLS –K); Nationallyrepresentative; N = 9,547 children who entered Kindergarten in 1998 Self control = ↓ r = -.07 (for Pre-K, center-based, Head Start) Center, Pre-K, Head Start, other nonparent; Pre- Externalizing = ↑ K vs all others r = .11 (for Pre-K, center-based, Head Start; Not true for Votruba-Drzal, Coley, & ChaseLansdale, 2004 3-5 years old 2-4 years old Votruba-Drzal, Coley, MaldonadoCarreño, LiGrining, & Chase-Lansdale, 2010 8-10 years old 2-4, 3-5 years old Solheim, Wichstrøm, Belsky, & BergNielsen, 2013 Yamauchi & Leigh, 2011 Zachrisson, Dearing, Lekhal, Toppelberg, 2013 4 years old 2-3 years old 36 months old kids in same school). Positive behavior = 0 Internalizing = 0 Hours in care at Externalizing = 0 first Mother Interaction of quality assessment x hours on all 3 measures Hours in care at Internalizing = 0 one or both Externalizing = 0 assessments Mother U.S. 3 cities. Low income single mothers. N = 204 U.S. 3 cities. Low income single mothers. N = 349 Cumulative hours 6-54 months old Social competence = 0 Externalizing = 0 Teacher Conflict w teacher ↑ , Cohen’s f2 = .05 Norway N = 995 From age 0-1 to 2-3 years old Cumulative amount 0-3 years old Approach = 0 Persistence = 0 nonReactivity = ↓ Average of all 3 scales = ↓ Parent Australia (Longitudinal Survey of Australian Children, Birth Cohort) N = 5,000 18 and 36 months Externalizing (with correction for Hours per week missing data), fixed at 18, 36 effects = 0 months Externalizing with listwise deletion = ↑ Mother Norwegian Mother and Child Cohort Study – populationbased. N about 75,000 6-54 months old ES = .04 for every added 10 hours Note. Where available, effect sizes are given for significant main effects. Except where noted, they are partial correlations of hours in care with the outcome, controlling for other variables in the model. They indicate in standard deviation units how much increase in the outcome is expected for an increase of one standard deviation in the predictor. Key: ↑ = positive coefficient for the association of quantity with dependent variable, p < .05. 0 = no significant association of quantity with dependent variable. ↓ = negative coefficient for the association of quantity with dependent variable, p < .05.

