jane12466-sup-0001-supinfo
advertisement
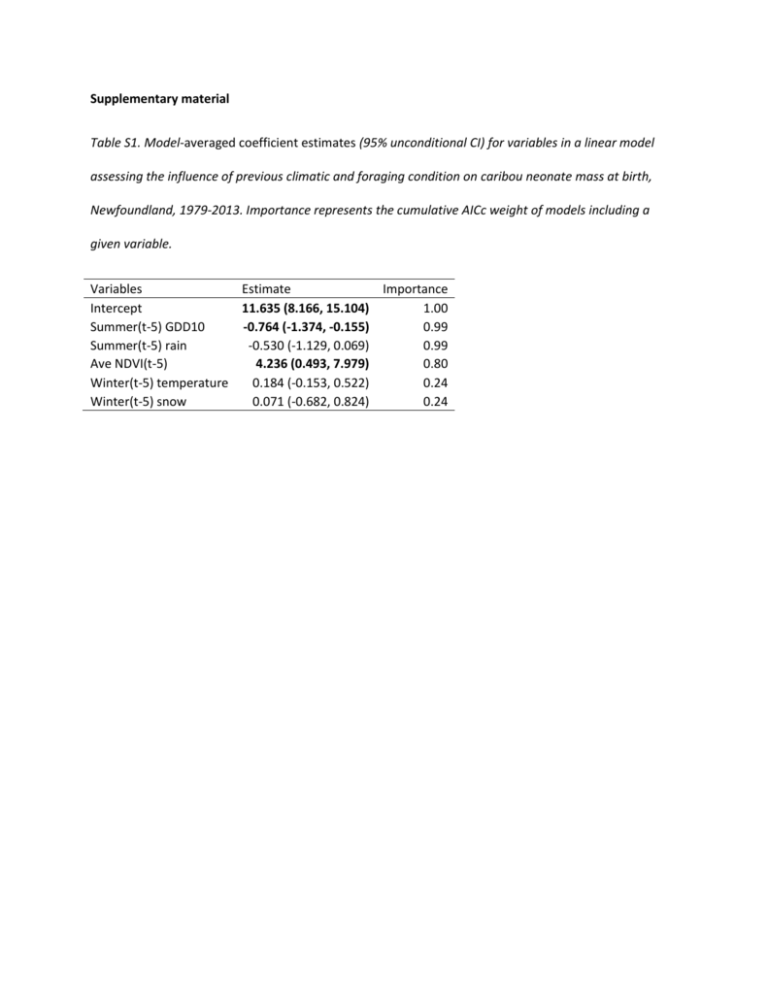
Supplementary material Table S1. Model-averaged coefficient estimates (95% unconditional CI) for variables in a linear model assessing the influence of previous climatic and foraging condition on caribou neonate mass at birth, Newfoundland, 1979-2013. Importance represents the cumulative AICc weight of models including a given variable. Variables Estimate Importance Intercept 11.635 (8.166, 15.104) 1.00 Summer(t-5) GDD10 -0.764 (-1.374, -0.155) 0.99 Summer(t-5) rain -0.530 (-1.129, 0.069) 0.99 Ave NDVI(t-5) 4.236 (0.493, 7.979) 0.80 Winter(t-5) temperature 0.184 (-0.153, 0.522) 0.24 Winter(t-5) snow 0.071 (-0.682, 0.824) 0.24 Table S2. Cause-specific hazard ratios for bear, coyotes, and other causes (95% CI) for variables in the top causes-specific Cox Proportional Hazard models for caribou neonate survival, Newfoundland, during the population decline period, including all monitored individuals. Hazards ratios >1 indicate increase in risk while hazard ratios <1 indicate reduction in risk. Statistically significant hazards ratios (α=0.05) are indicated in bold. Variable Black bear Coyote Other causes Spring GDD10 0.391 (0.176, 0.867) 1.182 (0.593, 2.359) 1.189 (0.617, 2.293) Spring rain 0.591 (0.440, 0.795) 1.289 (0.954, 1.740) 0.989 (0.775, 1.262) Spring rate >100 (<0.000, > 100) 5.424 (0, >100) 0.013 (0.000, >100) Winter snow 0.528 (0.364, 0.767) 1.053 (0.739, 1.502) 1.180 (0.848, 1.641) Winter(t-5) temperature 3.297 (1.735, 6.267) 1.173 (0.665, 2.068) 0.989 (0.586, 1.668) Winter(t-5) snow 0.690 (0.213, 2.242) 1.852 (0.602, 5.695) 0.471 (0.158, 1.405) Summer(t-5) GDD10 0.541 (0.173, 1.688) 5.744 (1.966, 16.78) 3.188 (1.103, 9.212) Summer(t-5) rain 1.055 (0.359, 3.099) 2.626 (0.916, 7.529) 1.710 (0.610, 4.793) AveNDVI(t-5) 0.000 (0.000, 1.001) 25.537 (0.003, >100) 0.000 (0.000, 0.015) Table S3. Cause-specific hazard ratios of neonatal caribou for bear, coyotes, and other causes (95% CI) in Newfoundland (1979-2013). Estimates are based on the top cause-specific Cox Proportional Hazard models for the population increase and decline periods. The periods of increase and decline were delineated using 1998 as a single year cut-off. Hazards ratios >1 indicate increase in risk while hazard ratios <1 indicate reduced risk. Variable Black bear Coyote Other causes Period of increase Winter(t-5) temperature 0.582 (0.428, 0.79) 1.065 (0.84, 1.351) Winter(t-5) snow 0.736 (0.201, 2.687) 6.022 (1.951, 18.59) Summer(t-5) GDD10 0.213 (0.053, 0.859) 1.22 (0.553, 2.691) Summer(t-5) rain 6.065 (2.112, 17.416) 0.133 (0.046, 0.384) Period of decline Spring GDD10 0.301 (0.135, 0.672) 0.897 (0.459, 1.753) 0.706 (0.371, 1.341) Spring rain 0.551 (0.409, 0.744) 1.306 (0.954, 1.788) 0.925 (0.725, 1.182) Spring rate of green-up >100 (0, >100) 0.007 (0, >100) 0 (0, 4.063) Winter snow 0.588 (0.412, 0.84) 1.111 (0.789, 1.566) 1.114 (0.81, 1.531) Winter(t-5) temperature 2.354 (1.245, 4.45) 0.732 (0.429, 1.248) 0.707 (0.42, 1.19) Winter(t-5) snow 0.395 (0.178, 0.877) 1.123 (0.561, 2.246) 0.284 (0.155, 0.52) Summer(t-5) GDD10 0.224 (0.077, 0.653) 1.907 (0.689, 5.274) 1.07 (0.399, 2.868) Summer(t-5) rain 0.723 (0.278, 1.879) 3.017 (1.104, 8.243) 1.627 (0.694, 3.815) AvgNDVI(t-5) 0 (0, 8.812) 1.022 (0, 15993.355) 0 (0, 0) Table S4. Cause-specific hazard ratios of neonatal caribou for bear, coyotes, and other causes (95% CI) in Newfoundland (1980-2010). Estimates are based on the top cause-specific Cox Proportional Hazard models for the population increase and decline periods. The period of increase was limited to 1980-1990 and the period of decline to 2000-2010. Hazards ratios >1 indicate increase in risk while hazard ratios <1 indicate reduced risk. Variable Black bear Coyote Other causes Period of increase Winter(t-5) temperature 0.46 (0.201, 1.049) >100 (0, >100) Winter(t-5) snow 2.536 (0.264, 24.404) >100 (0, >100) Summer(t-5) GDD10 0.166 (0.015, 1.815) 0 (0, >100) Summer(t-5) rain 4.404 (0.384, 50.471) 0 (0, >100) Period of decline Spring GDD10 0.336 (0.056, 2.003) 0.896 (0.176, 4.557) 4.397 (0.991, 19.514) Spring rain 0.838 (0.476, 1.475) 1.073 (0.645, 1.783) 0.984 (0.651, 1.489) Spring rate of green-up >100 (0, >100) 0 (0, >100) >100 (0.004, >100) Winter snow 0.684 (0.398, 1.177) 1.092 (0.61, 1.953) 1.223 (0.748, 1.999) Winter(t-5) temperature 8.41 (2.205, 32.082) 2.507 (0.658, 9.552) 0.867 (0.316, 2.378) Winter(t-5) snow 0.538 (0.029, 9.872) 1.09 (0.072, 16.53) 0.315 (0.021, 4.737) Summer(t-5) GDD10 0.048 (0.001, 1.585) 5.992 (0.12, 300.178) 1.634 (0.056, 47.536) Summer(t-5) rain 4.037 (0.314, 51.924) 1.373 (0.113, 16.668) 5.963 (0.682, 52.153) AvgNDVI(t-5) 0 (0, 55363.432) 0 (0, 7403.754) 0.004 (0, 299299.158) Table S5. Locality of the Environment Canada weather stations used for the estimation of weather variables for each herds, 1979-2013. Herd Corner Brook Lakes Gaff Topsails Grey River Gros Morne Lapoile Middle Ridge Mount Peyton Northern Peninsula Pot Hill Sandy Lake Years monitored Locality 1994-1997 Deer Lake 2003-2004 Exploit Dam 1979-1992 Exploit Dam 1993-1996 Deer Lake 1985-2012 Stephenville 1983-2013 Bay d’Espoir 1993-2003 Grand Falls 2008-2012 Plum Point 1980-1982 Grand Falls 1982-1984 Exploit Dam Figure S1: Pairwise correlation matrix of climatic variables potentially included in survival model of neonatal caribou survival. Figure S2: Time-series of climatic variables from six different weather stations used to estimate climate for the different herds and retained in the list of candidate models of neonatal caribou survival. Figure S3: Time-series of NDVI related variables estimated for the 10 different herds retained in the list of candidate models of neonatal caribou survival. Figure S4: Cause-specific hazard ratios illustrating the relationship between average daily climatic variables and neonatal caribou survival for bear and coyotes in Newfoundland (1979-2013). Estimates are based on the top cause-specific Cox proportional hazard models for the population increase and decline periods. Only significant variables are presented.
