Stat 240 - Learning Objectives
advertisement
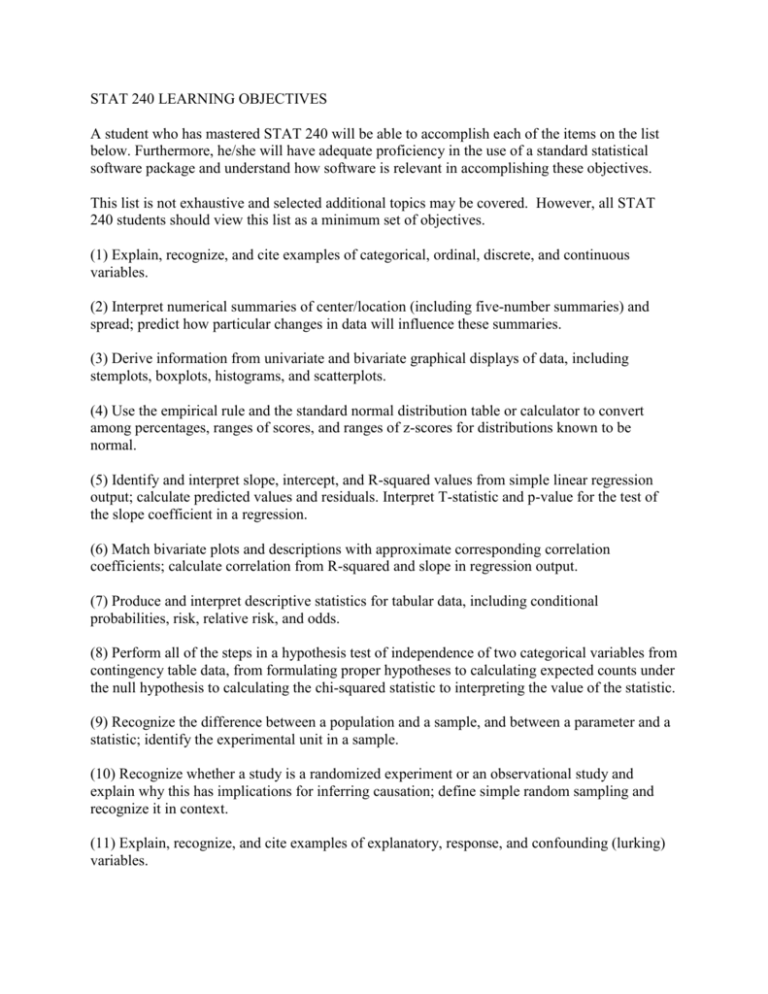
STAT 240 LEARNING OBJECTIVES A student who has mastered STAT 240 will be able to accomplish each of the items on the list below. Furthermore, he/she will have adequate proficiency in the use of a standard statistical software package and understand how software is relevant in accomplishing these objectives. This list is not exhaustive and selected additional topics may be covered. However, all STAT 240 students should view this list as a minimum set of objectives. (1) Explain, recognize, and cite examples of categorical, ordinal, discrete, and continuous variables. (2) Interpret numerical summaries of center/location (including five-number summaries) and spread; predict how particular changes in data will influence these summaries. (3) Derive information from univariate and bivariate graphical displays of data, including stemplots, boxplots, histograms, and scatterplots. (4) Use the empirical rule and the standard normal distribution table or calculator to convert among percentages, ranges of scores, and ranges of z-scores for distributions known to be normal. (5) Identify and interpret slope, intercept, and R-squared values from simple linear regression output; calculate predicted values and residuals. Interpret T-statistic and p-value for the test of the slope coefficient in a regression. (6) Match bivariate plots and descriptions with approximate corresponding correlation coefficients; calculate correlation from R-squared and slope in regression output. (7) Produce and interpret descriptive statistics for tabular data, including conditional probabilities, risk, relative risk, and odds. (8) Perform all of the steps in a hypothesis test of independence of two categorical variables from contingency table data, from formulating proper hypotheses to calculating expected counts under the null hypothesis to calculating the chi-squared statistic to interpreting the value of the statistic. (9) Recognize the difference between a population and a sample, and between a parameter and a statistic; identify the experimental unit in a sample. (10) Recognize whether a study is a randomized experiment or an observational study and explain why this has implications for inferring causation; define simple random sampling and recognize it in context. (11) Explain, recognize, and cite examples of explanatory, response, and confounding (lurking) variables. (12) Distinguish between independence and mutual exclusivity of events; recognize and apply these concepts in word problems when appropriate; be able to use the multiplication and addition rules to find probabilities (13) Calculate the expected value of a random quantity when given its possible values and corresponding probabilities; relate this idea to the notion of a weighted average. (14) Recognize situations involving binomial random variables from word problems; correctly calculate binomial probabilities, expectations (means), and standard deviations for these situations. (15) Recognize similarity among all confidence intervals; exploit this similarity to derive intervals with arbitrary confidence level for common population quantities involving proportions and means. (16) Give correct informal and formal explanations of any confidence interval; understand how factors like sample size, confidence level, and estimated standard deviation of estimator (i.e., standard error) affect the width of a confidence interval. (17) Correctly construct null and alternative hypotheses about population quantities using context of real-life situations. (18) Recognize similarity among all test statistics of the standardized score variety; exploit this similarity to derive test statistics for common tests involving proportions and means. (19) Calculate a p-value using the test statistic along with the alternative hypothesis; correctly define the p-value and recognize common erroneous definition of p-value. (20) Interpret p-values and/or confidence intervals to make decisions about hypotheses; identify type-I and type-2 error possibilities; relate power of a test to type-2 error. (21) Recognize and distinguish among the various specific inference situations one may commonly encounter, including one mean/proportion, difference of two means/proportions (and the notion of pooled variance), and paired means; apply and interpret confidence intervals and tests in these situations as appropriate. (22) Recognize the situation in which the analysis of variance (ANOVA) is appropriate and be able to perform one-way ANOVA with the assistance of computer software.
