AA, ICP
advertisement
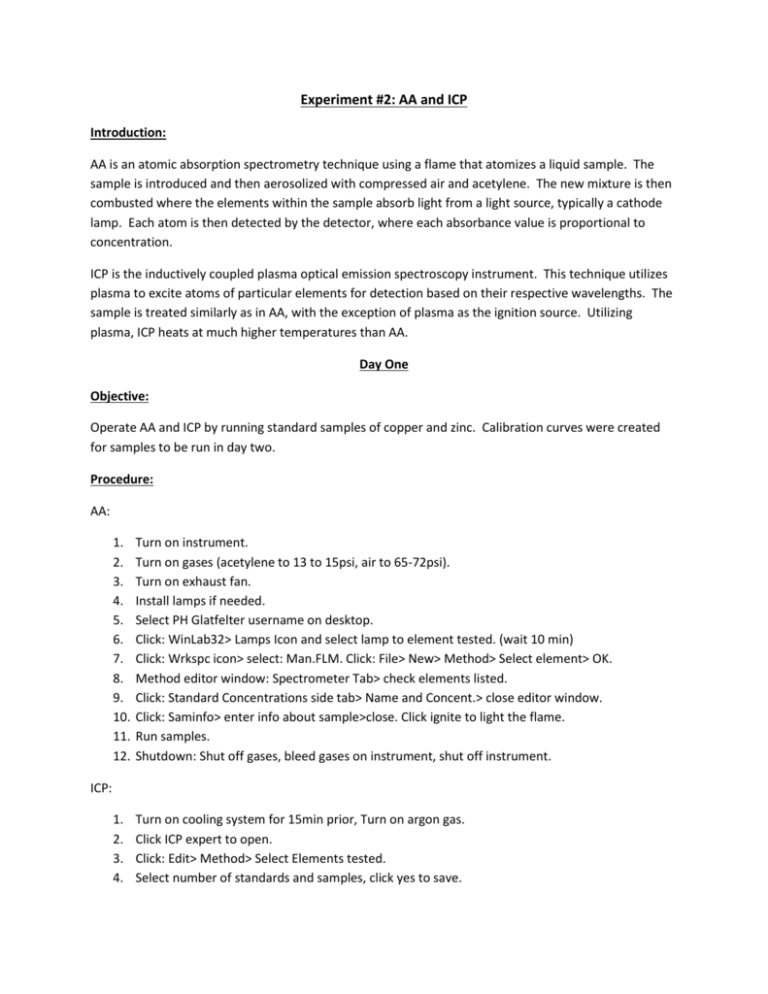
Experiment #2: AA and ICP Introduction: AA is an atomic absorption spectrometry technique using a flame that atomizes a liquid sample. The sample is introduced and then aerosolized with compressed air and acetylene. The new mixture is then combusted where the elements within the sample absorb light from a light source, typically a cathode lamp. Each atom is then detected by the detector, where each absorbance value is proportional to concentration. ICP is the inductively coupled plasma optical emission spectroscopy instrument. This technique utilizes plasma to excite atoms of particular elements for detection based on their respective wavelengths. The sample is treated similarly as in AA, with the exception of plasma as the ignition source. Utilizing plasma, ICP heats at much higher temperatures than AA. Day One Objective: Operate AA and ICP by running standard samples of copper and zinc. Calibration curves were created for samples to be run in day two. Procedure: AA: 1. 2. 3. 4. 5. 6. 7. 8. 9. 10. 11. 12. Turn on instrument. Turn on gases (acetylene to 13 to 15psi, air to 65-72psi). Turn on exhaust fan. Install lamps if needed. Select PH Glatfelter username on desktop. Click: WinLab32> Lamps Icon and select lamp to element tested. (wait 10 min) Click: Wrkspc icon> select: Man.FLM. Click: File> New> Method> Select element> OK. Method editor window: Spectrometer Tab> check elements listed. Click: Standard Concentrations side tab> Name and Concent.> close editor window. Click: Saminfo> enter info about sample>close. Click ignite to light the flame. Run samples. Shutdown: Shut off gases, bleed gases on instrument, shut off instrument. 1. 2. 3. 4. Turn on cooling system for 15min prior, Turn on argon gas. Click ICP expert to open. Click: Edit> Method> Select Elements tested. Select number of standards and samples, click yes to save. ICP: 5. Hit ignite button to light plasma. Wait 5 to 10 min 6. Sequence editor, click on analysis screen> green arrow at top. Cleaning arrow after each sample. 7. Run Standards. Select number of samples and then deselect begin with calibration and end with calibration. 8. Analysis screen select samples (turn to yellow). 9. Analyze data by clicking on data symbols. 10. Shutdown: Click torch symbol, with x to turn off torch and ICP. Turn off cooling system. Data: Initial stock solutions were too concentrated for instrumental techniques, smaller concentrations were prepared. Sample sizes: 0.1, 0.3, 0.5, 0.8, 1.0ppm from a diluted stock solution of 1000ppm to 100ppm and 10ppm. Cu AA Standards 1.600 Intensity (c/s) 1.400 1.200 1.000 0.800 0.600 0.400 0.200 0.000 0 10 20 30 40 Concentration (ppm) 50 60 Zn AA Standards Intensity (c/s) 2.000 1.800 1.600 1.400 1.200 1.000 0.800 0.600 0.400 0.200 0.000 y = 0.0144x + 1.1247 R² = 0.693 0 10 20 30 40 50 60 Concentration (ppm) Calculations: 𝑉= 100𝑝𝑝𝑚×100𝑚𝐿 1000𝑝𝑝𝑚 V=10mL 𝑉= 10𝑝𝑝𝑚×100𝑚𝐿 100𝑝𝑝𝑚 V=10mL 0.1ppm requires 1.0mL 0.3ppm requires 3mL 0.5ppm requires 5mL 0.8ppm requires 8mL 1.0ppm requires 10mL Data:. ICP standards were combined into one sample and ran, since it is capable of testing both elements. Three water samples were ran on AA and ICP: Men’s bathroom, Women’s bathroom and Men’s water fountain. Conclusion: Standardization was a failure, but this was not realized until later. Concentrations were too high. Calibration curves could be created for AA, although they are very weak concerning the area of study. Each sample tested did provide intensities for copper and zinc in the water sources, however, without a proper calibration curve, their concentration remains unclear.
