Mathematical Studies Standard Level for the IB Diploma
Revision Topic 6: Mathematical models
Chapter 17: Functions and graphs
What is a function?
A function is a ‘machine’ that does something to one number to turn it into another.
Starting with a set of ‘input’ numbers, the function will create a second set of ‘output’
numbers.
Functions are often written as f ( x) or g ( x) , but you can use any letters for the function
name and the variable.
Many common functions can be expressed using a formula, which may involve specific
‘elementary’ functions such as sin( x) or e x .
You are expected to use your GDC when working with functions and graphs.
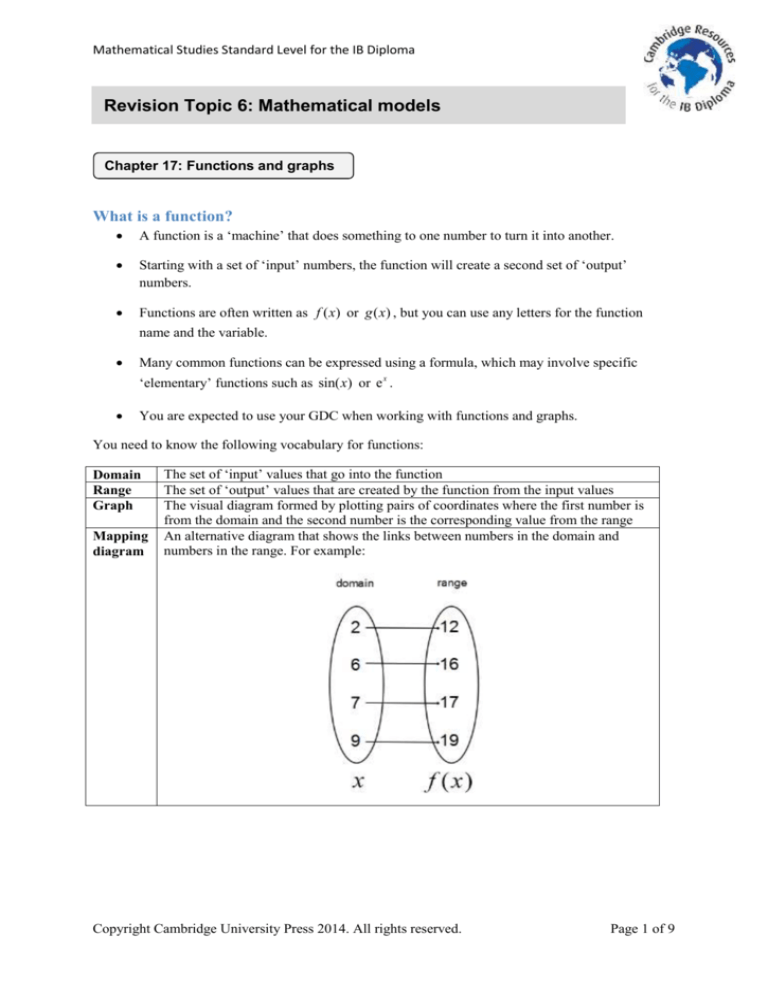
You need to know the following vocabulary for functions:
Domain
Range
Graph
Mapping
diagram
The set of ‘input’ values that go into the function
The set of ‘output’ values that are created by the function from the input values
The visual diagram formed by plotting pairs of coordinates where the first number is
from the domain and the second number is the corresponding value from the range
An alternative diagram that shows the links between numbers in the domain and
numbers in the range. For example:
Copyright Cambridge University Press 2014. All rights reserved.
Page 1 of 9
Mathematical Studies Standard Level for the IB Diploma
Finding the range when given the function and the domain
To do this, use your GDC as follows:
Texas TI-84
Casio fx-9750GII
Enter the function into
the GDC.
Access the values in the
table and scroll down to
look at the Y1 values
corresponding to each X
value. The X values are
the domain and the Y1
values give the range.
Finding the domain and range from a graph
You need to be able to work out the domain and range of a function from its graph. Remember the
following points:
The domain is made up of the values of x for which f ( x) has output values (i.e. ycoordinates).
The range is found by putting every value of the domain into f ( x) in place of the x and
working out the answer. For example, if f ( x) x3 3x 5 , then for x =4 you would calculate
f (4) 43 3 4 5 57 .
Copyright Cambridge University Press 2014. All rights reserved.
Page 2 of 9
Mathematical Studies Standard Level for the IB Diploma
For either the domain or range, there are four possible situations:
Situation
Example of how the graph
might look like
In formal notation this
would look like
The values are unlimited
The domain is x
There is a minimum value
The domain is x 2
There is a maximum value
The range is f ( x) 5
The values are between two limits
The domain is 0 x 7
The domain and range could each be in either one of these categories and should be considered
separately when analysing the graph.
Copyright Cambridge University Press 2014. All rights reserved.
Page 3 of 9
Mathematical Studies Standard Level for the IB Diploma
Rational functions
These are functions that are in the form of a fraction or ‘ratio’.
If the denominator of the fraction contains the variable x of the domain, then the graph will have a
break in it. A line which shows where the break occurs is called an asymptote.
This graph has two asymptotes: a
horizontal one with equation y = −2
and a vertical one with equation x = 3.
If you use your GDC to plot the graph of a rational function, you can find the values for the
asymptotes by looking at the table of values:
Vertical
asymptote
Horizontal
asymptote
Look for where there is an ERROR message in the second (Y1) column and use the
value of X that corresponds to that error.
The values in the second (Y1) column will get closer and closer to a certain number.
This number is the value of y to use for the equation.
Drawing graphs and diagrams
In the exam and when solving other problems, you often need to create an appropriate diagram. When
asked to ‘draw’, ‘plot’ or ‘sketch’, you need to know what to do:
Wording
Sketch
Plot
Draw
This means you will need to do the following
Use your GDC to draw the graph, and then make a diagram based on it that shows the
key features of the graph such as intercepts, asymptotes and turning points.
Calculate a set of coordinate pairs, plot these points, and then draw a line or curve
through them.
Make a diagram that is accurate and to scale; straight lines should be drawn with a ruler.
Solving equations using graphs on your GDC
Split the equation at the equals sign and put each half in as a graph equation on your GDC.
Draw the two graphs; the solution is the x value(s) where the lines cross.
Use the ‘intersection’ tool to find the solution.
If the lines don’t cross, then there is no solution.
For example, if the equation to solve is 4e3 x 2 6 7 x2 5 x 2 , then split it to make y 4e3 x 2 6
and y 7 x2 5x 2 , draw the graphs of these two equations and look for their intersection.
Copyright Cambridge University Press 2014. All rights reserved.
Page 4 of 9
Mathematical Studies Standard Level for the IB Diploma
Chapter 18: Linear and quadratic models
Linear models
Linear means ‘straight line’, so linear equations will be of the form y mx c or
ax by d 0
Linear functions are of the form f ( x) mx c
When solving problems involving linear models, it is helpful to draw a graph of the equations.
The answer is normally where the lines intersect with each other or with one of the axes.
Commonly asked questions can involve profit revenue cost
Quadratic functions and their graphs
Questions may be stated using either the y or the f ( x) notation, and it is important that you use
the correct format in written answers, even if you can readily interchange the two forms in your mind.
A quadratic function has the form f ( x) ax2 bx c where a 0 .
The graph of a quadratic function is a parabola or
U-shaped curve with the following properties:
The curve is symmetrical about the
vertical line through its minimum or
maximum point.
If a > 0, the curve will be like a ;
if a < 0, the curve will be upside down
and so look like .
You need to be able to find certain properties of the curve and relate them to the quadratic function or
vice versa.
To find
x-intercept
y-intercept
The equation
of the line of
symmetry
How to work this out from the function
Solve the equation formed by setting
f ( x) 0
Calculate f (0) c
b
2a
(this is given in the formula booklet)
The equation is x
The value of b
Use the x value of the symmetry line and
the value of a to get b (= 2ax).
The minimum
or maximum
value of f ( x)
b
Find the value of f
2a
How to get this from the curve
Use the ‘root’ function on your GDC
Look at the value of y when x = 0
Pick two points on a horizontal line that
intersects the curve.
The equation of the line will be
x average of their x-coordinates
Use the ‘max’ or ‘min’ function on
your GDC
Copyright Cambridge University Press 2014. All rights reserved.
Page 5 of 9
Mathematical Studies Standard Level for the IB Diploma
You also need to be able to define the following values in relation to the function:
Domain
Range
The x values for which f ( x) has an output (y) value
The possible values of f ( x)
Quadratic models
In problems involving quadratic models, you will be given a function in the form described above.
To find the answers to any questions asked, you should do the following:
Draw the function on your GDC.
Interpret the text in the question and write it down in mathematical notation. For example, if
the question involves time, then at the beginning t 0 ; and if the process takes ten seconds,
then you have t 10 at the end.
When writing down your answer, put it in the context of the original question.
Copyright Cambridge University Press 2014. All rights reserved.
Page 6 of 9
Mathematical Studies Standard Level for the IB Diploma
Chapter 19: Exponential and polynomial functions
Exponential functions and their graphs
An exponential function is a function where the output value is multiplied by a fixed amount for each
unit of increase in the input value.
An exponential growth function has the form f ( x) ka x c where a 1 and k 0 .
An exponential decay function has the form f ( x) ka x c (with a negative sign in the
exponent).
The graphs of f ( x) ka x c and f ( x) ka x c are reflections of each other in the y-axis.
The y-intercept value is k c .
The value of c affects the graph’s vertical position. If c > 0 the curve is shifted up relative to
the y ka x curve; if c < 0 the curve is shifted down.
If k > 0 the curve lies above y = c; if k < 0 the curve lies below y = c. The size of k determines
how steep the curve is.
Horizontal asymptote
Exponential graphs level off to a particular value, which they get close to but never actually reach.
This value corresponds to a horizontal asymptote.
The equation of the asymptote will be y = c. If the function is of the form f ( x) ka x , with no c, then
the horizontal asymptote is y = 0.
Copyright Cambridge University Press 2014. All rights reserved.
Page 7 of 9
Mathematical Studies Standard Level for the IB Diploma
Polynomial functions
A polynomial function is made up of powers of the independent variable, normally x.
It can be written in the following form:
f ( x) axn bxm …;
n, m
The powers must be non-negative integers, and there may be more than two terms.
Here are some elements of the graphs of polynomial functions that you may need to identify, either to
draw or sketch the curve or to answer a question.
Graph
element
x-intercept(s)
What it
means in
terms of the
function
The root(s)
or solution(s)
of the
equation
f ( x) 0
How to find it
Illustration
Use the GDC to solve
f ( x) 0 using the
graph or the equation
solver
y-intercept
The value of
f (0)
Use the GDC table to
find this value, or read
it off from the function
(it will be the constant
term, i.e. a number on
its own)
Turning points
The
maximum or
minimum
points of
f ( x)
Use the GDC graph
and the minimum and
maximum functions
Rational functions and vertical asymptotes
In a function of the form f ( x) axn bxm …, if any of the powers is a negative integer, then the
function is not a polynomial; instead, it is a rational function, and includes a fraction which has the
variable in the denominator. This means the graph will have a vertical asymptote.
You can find the x value of the vertical asymptote by looking at the table on your GDC; find the value
in the first column that gives an ERROR message in the second column.
Copyright Cambridge University Press 2014. All rights reserved.
Page 8 of 9
Mathematical Studies Standard Level for the IB Diploma
Exponential and polynomial models
When working with an exponential or polynomial model, the formula may seem very complex, but
you are expected to use your GDC to help you find the answer.
Before you start trying to answer any questions:
Texas TI-84
Casio fx-9750GII
Put the model into your GDC.
Do this in the same way as you
would enter any equation; it
might mean that you have to
switch to using X instead of
the variable given in the
formula. This doesn’t matter –
just remember to switch back
to the original variable when
you write down your final
answer.
Change the domain to fit the
model you are working with:
Set the minimum value of the
domain and the amount that
you want it to increment by.
Then use the table to answer
questions relating to particular
values of either the domain or
the range.
Copyright Cambridge University Press 2014. All rights reserved.
Page 9 of 9

