September 2015
advertisement
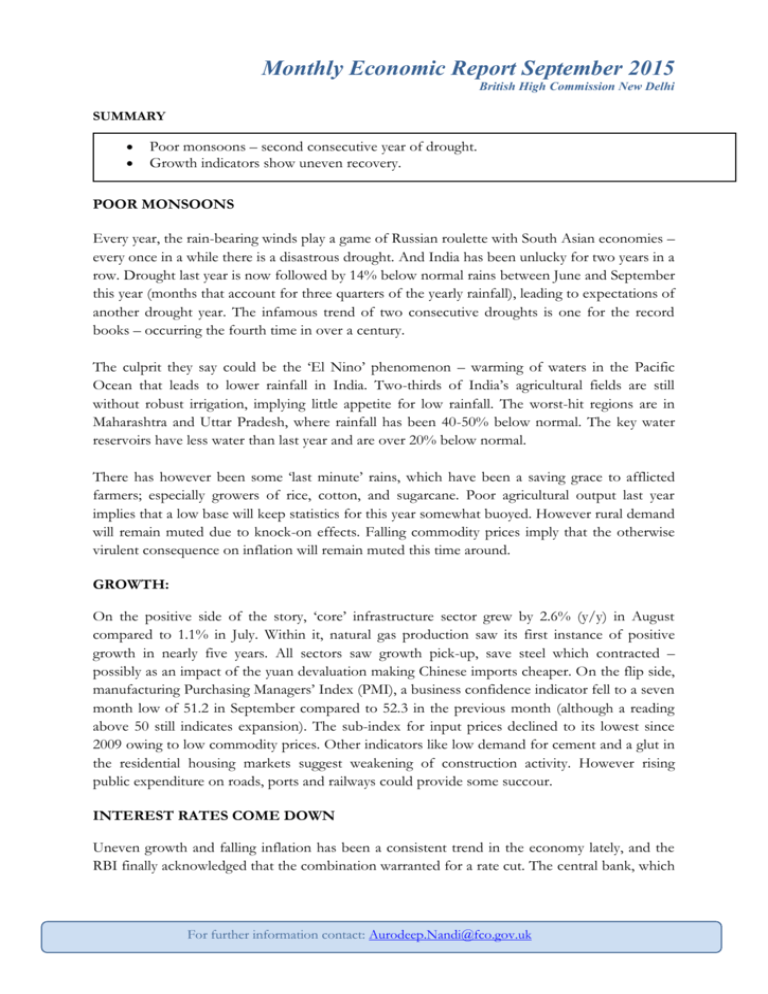
Monthly Economic Report September 2015 British High Commission New Delhi SUMMARY Poor monsoons – second consecutive year of drought. Growth indicators show uneven recovery. POOR MONSOONS Every year, the rain-bearing winds play a game of Russian roulette with South Asian economies – every once in a while there is a disastrous drought. And India has been unlucky for two years in a row. Drought last year is now followed by 14% below normal rains between June and September this year (months that account for three quarters of the yearly rainfall), leading to expectations of another drought year. The infamous trend of two consecutive droughts is one for the record books – occurring the fourth time in over a century. The culprit they say could be the ‘El Nino’ phenomenon – warming of waters in the Pacific Ocean that leads to lower rainfall in India. Two-thirds of India’s agricultural fields are still without robust irrigation, implying little appetite for low rainfall. The worst-hit regions are in Maharashtra and Uttar Pradesh, where rainfall has been 40-50% below normal. The key water reservoirs have less water than last year and are over 20% below normal. There has however been some ‘last minute’ rains, which have been a saving grace to afflicted farmers; especially growers of rice, cotton, and sugarcane. Poor agricultural output last year implies that a low base will keep statistics for this year somewhat buoyed. However rural demand will remain muted due to knock-on effects. Falling commodity prices imply that the otherwise virulent consequence on inflation will remain muted this time around. GROWTH: On the positive side of the story, ‘core’ infrastructure sector grew by 2.6% (y/y) in August compared to 1.1% in July. Within it, natural gas production saw its first instance of positive growth in nearly five years. All sectors saw growth pick-up, save steel which contracted – possibly as an impact of the yuan devaluation making Chinese imports cheaper. On the flip side, manufacturing Purchasing Managers’ Index (PMI), a business confidence indicator fell to a seven month low of 51.2 in September compared to 52.3 in the previous month (although a reading above 50 still indicates expansion). The sub-index for input prices declined to its lowest since 2009 owing to low commodity prices. Other indicators like low demand for cement and a glut in the residential housing markets suggest weakening of construction activity. However rising public expenditure on roads, ports and railways could provide some succour. INTEREST RATES COME DOWN Uneven growth and falling inflation has been a consistent trend in the economy lately, and the RBI finally acknowledged that the combination warranted for a rate cut. The central bank, which For further information contact: Aurodeep.Nandi@fco.gov.uk Monthly Economic Report September 2015 British High Commission New Delhi had long kept policy rates elevated in a bid to keep inflation low; reduced the repo rate by a sizeable 50 bps to 6.75%. The RBI has stated that much of its rate cuts haven’t been adequately transmitted by banks to consumer through lower lending rates; shifting the onus of growth on more efficient monetary policy transmission, rather than more rate cuts. Monthly Economic Report September 2015 British High Commission New Delhi GROWTH: Industrial production growth picks up. Capital goods’ growth shows sharp increase. GDP Projects Under Implementation GDP Industry IIP/Capital/Consumer Goods 11 Services 9 12 10 7 8 5 6 Capital goods Consumer goods 30 6 25 5 20 4 15 3 10 2 5 1 3 4 1 0 Jun-12 Dec-12 Jun-13 Dec-13 Jun-14 Dec-14 Jun-15 -1 Sep-13 May-14 Jan-15 Sep-15 INFLATION: Wholesale and retail inflation remain muted. Wholesale Price Index (% y/y) Food vs. Core Inflation (% y/y) 12 Food Inflation 10 7 5 3 10 Jul-10 Mar-11 Nov-11 Jul-12 Mar-13 Nov-13 Jul-14 1 -1 Jul-12 Jan-13 Jul-13 Jan-14 Jul-14 Jan-15 Jul-15 -5 -6 Oct-14 Jan-15 Apr-15 Jul-15 -10 -2 -15 -3 -20 -4 -25 8.0 7.0 6.0 5.0 0 0 -4 Jul-14 2 5 Mar-15 Apr-14 4 15 0 Jan-14 6 20 2 Oct-13 9.0 Core Inflation [Right] 8 4 -5 Jul-13 Consumer Price Index (% y/y) 25 6 0 0 -1 2 -2 IIP [Left] 7 14 -2 -3 4.0 3.0 Feb-14 May-14 Aug-14 Nov-14 Feb-15 May-15 Aug-15 MARKETS: Financial markets recover somewhat from last month’s disturbances in Chinese markets SENSEX USD/INR 10yr Govt. Securities yield (%) 31000 67 9.0 29000 66 8.8 27000 65 25000 64 23000 63 8.0 21000 62 7.8 19000 8.4 8.2 7.6 61 17000 15000 Oct-13 8.6 7.4 60 Feb-14 Jun-14 Oct-14 Feb-15 7.2 59 Jun-14 Jun-15 Sep-14 Dec-14 Mar-15 Jun-15 Sep-15 7.0 Jun-14 Sep-14 Dec-14 Mar-15 Jun-15 Sep-15 EXTERNAL: Current Account Deficit sharply narrows in Q4 FY15. FDI ($ Bn) FII ($ Bn) Current vs. Capital A/c ($ Bn) 10 5 4.5 Current account balance ($ bn) 4 30.0 6 3.5 3 Capital Account Balance 40.0 8 20.0 4 10.0 2.5 2 2 1.5 0 1 -2 Jul-13 0.5 0 Jul-13 Nov-13 Mar-14 Jul-14 Nov-14 Mar-15 Jul-15 Nov-13 Mar-14 Jul-14 Nov-14 Mar-15 Jul-15 Imports -30.0 -6 -40.0 60 0.0 Aug-13 -10.0 Aug-13 -20.0 Aug-14 Feb-15 Aug-15 -10 0 Aug-13 Dec-13 Apr-14 Aug-14 Dec-14 Apr-15 Aug-15 -12 -20 -40 -60 -30.0 -8 20 Feb-14 -80 Nov-11 Jul-12 Mar-13 Nov-13 Jul-14 Mar-15 Trade Balance ($ Bn) -6 40 10.0 Mar-11 -4 Petroleum crude & products imports Non-Oil items imports Exports 20.0 Jul-10 -20.0 -4 TRADE: Marginal improvement in exports, while import contraction accentuates. Export/Import Growth (% y/y) Imports- Oil and Non Oil (% y/y) 30.0 0.0 Mar-09 Nov-09 -10.0 -14 -16 -18 Apr-14 Dec-14 Aug-15
