Subduction zones - Curriculum Support
advertisement

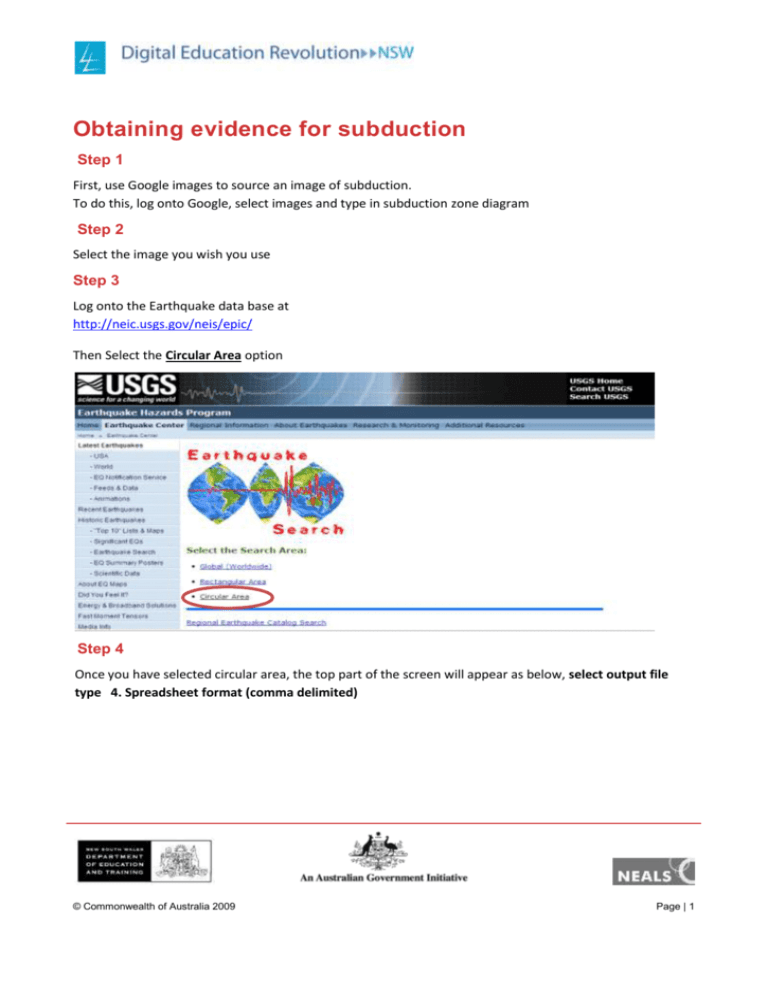
Obtaining evidence for subduction Step 1 First, use Google images to source an image of subduction. To do this, log onto Google, select images and type in subduction zone diagram Step 2 Select the image you wish you use Step 3 Log onto the Earthquake data base at http://neic.usgs.gov/neis/epic/ Then Select the Circular Area option Step 4 Once you have selected circular area, the top part of the screen will appear as below, select output file type 4. Spreadsheet format (comma delimited) © Commonwealth of Australia 2009 Page | 1 Earthquake Hazards Program: Circular Area Earthquake Search http://neic.usgs.gov/neis/epic/epic_circ.html Step 5 Scroll down the screen until you come to the area that allows you to input circular area search parameters. As we want to search for earth quakes in and around the Marianas Trench, we will need to input the latitude (11 N) and longitude (142 E) figures for this area with a search radius of 500 Km's. There will be a large amount of data available so we will want to limit the amount of information that we focus our analysis on. Select a minimum magnitude of 4 and a maximum magnitude of 10, with a date range between 1/1/2008 till end of July 2009 as seen below. You can choose different dates if you like and select different depth parameters. That way a number of groups could independently collect different datasets from which different graphs can be drawn. © Commonwealth of Australia 2009 Page | 2 Earthquake Hazards Program: Circular Area Earthquake Search http://neic.usgs.gov/neis/epic/epic_circ.html Hint: Leave the intensity fields blank Then press the submit search button immediately below minimum intensity. Step 6 The data base will generate a list of events (part of which is seen below). Highlight the entire list (including headings). With the cursor on the highlighted list, right click the mouse button and select copy. One of the first things you might notice is just how many earthquakes occur in this relatively small area. This suggests that the area is a "tectonically" active zone. © Commonwealth of Australia 2009 Page | 3 NEIC: Earthquake Search Results Step 7 Start Microsoft Excel, use alt-tab to switch screens back to the search results, select and copy the data from the Earthquake Search Results and paste these into the top left hand cell (A,1)of your blank Excel spreadsheet. It should look like the data set shown below: © Commonwealth of Australia 2009 Page | 4 Results in Excel Step 8 Highlight Column A then, from the Data toolbar select text to columns This will place the data selected into separate columns and enable you to manipulate the data more easily in order to analyse trends and identify patterns. © Commonwealth of Australia 2009 Page | 5 Data converted to an expanded table in Excel Step 9 Highlight the longitude column and the depth column. If they are side by side you may simply drag the mouse over both column headers to select both. If they are in columns separated by other data select the longitude column and while holding down the control key, highlight the depth column. Screen clipping showing scatter graph tool selected © Commonwealth of Australia 2009 Page | 6 Step 10 With both columns highlighted, select Insert and select Scatter, then select Scatter only with markers. This will then produce a plot titled Depth. (sample shown below) Scatter graph drawn in Excel © Commonwealth of Australia 2009 Page | 7 Step 11 To enable us to build a model from the data that enables closer analysis of the characteristics of earthquake activity around a subduction zone we can manipulate the data in the following way. Right click on the axis of the chart to format the chart. Click in the box to reverse the axis so depth goes down. Select the Layout menu and Axis Titles. Change the axis titles to longitude on the horizontal axis and depth on the vertical axis. Select Chart title to add a label to identify your graph if you want. © Commonwealth of Australia 2009 Page | 8 This will then produce a plot with depth (in Km's) on the Y axis and longitude on the X axis. Assessment of learning Describe how this graph supports the concept of subduction. © Commonwealth of Australia 2009 Page | 9


