Effect on Animals - AIHEC STEM Resources Portal
advertisement
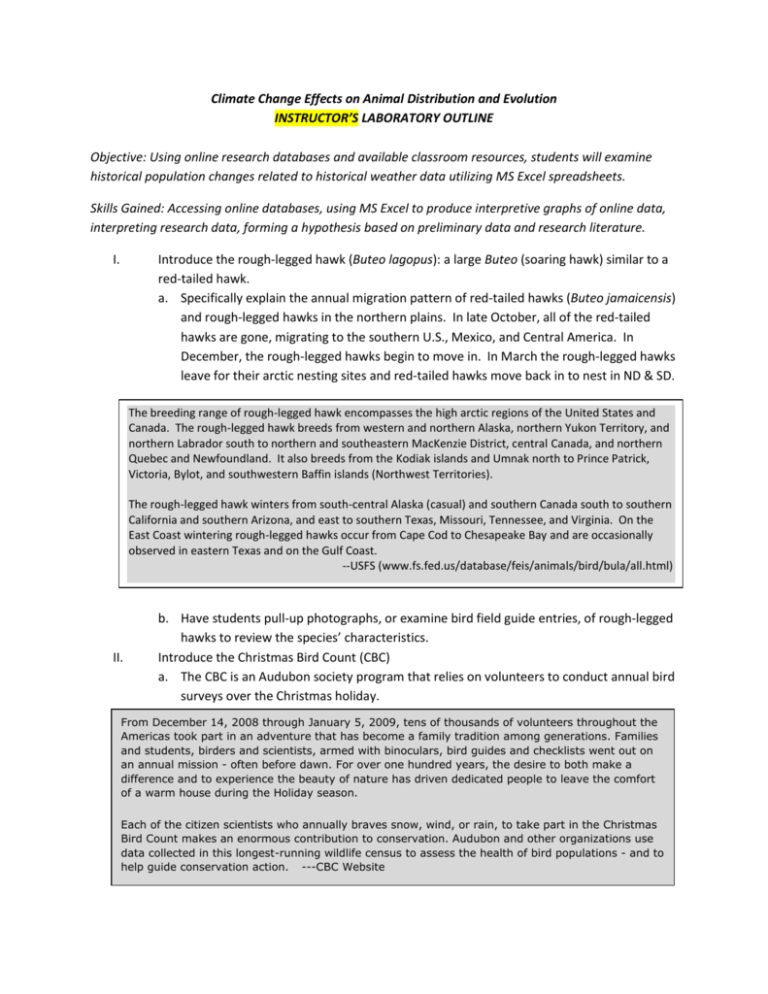
Climate Change Effects on Animal Distribution and Evolution INSTRUCTOR’S LABORATORY OUTLINE Objective: Using online research databases and available classroom resources, students will examine historical population changes related to historical weather data utilizing MS Excel spreadsheets. Skills Gained: Accessing online databases, using MS Excel to produce interpretive graphs of online data, interpreting research data, forming a hypothesis based on preliminary data and research literature. I. Introduce the rough-legged hawk (Buteo lagopus): a large Buteo (soaring hawk) similar to a red-tailed hawk. a. Specifically explain the annual migration pattern of red-tailed hawks (Buteo jamaicensis) and rough-legged hawks in the northern plains. In late October, all of the red-tailed hawks are gone, migrating to the southern U.S., Mexico, and Central America. In December, the rough-legged hawks begin to move in. In March the rough-legged hawks leave for their arctic nesting sites and red-tailed hawks move back in to nest in ND & SD. The breeding range of rough-legged hawk encompasses the high arctic regions of the United States and Canada. The rough-legged hawk breeds from western and northern Alaska, northern Yukon Territory, and northern Labrador south to northern and southeastern MacKenzie District, central Canada, and northern Quebec and Newfoundland. It also breeds from the Kodiak islands and Umnak north to Prince Patrick, Victoria, Bylot, and southwestern Baffin islands (Northwest Territories). The rough-legged hawk winters from south-central Alaska (casual) and southern Canada south to southern California and southern Arizona, and east to southern Texas, Missouri, Tennessee, and Virginia. On the East Coast wintering rough-legged hawks occur from Cape Cod to Chesapeake Bay and are occasionally observed in eastern Texas and on the Gulf Coast. --USFS (www.fs.fed.us/database/feis/animals/bird/bula/all.html) II. b. Have students pull-up photographs, or examine bird field guide entries, of rough-legged hawks to review the species’ characteristics. Introduce the Christmas Bird Count (CBC) a. The CBC is an Audubon society program that relies on volunteers to conduct annual bird surveys over the Christmas holiday. From December 14, 2008 through January 5, 2009, tens of thousands of volunteers throughout the Americas took part in an adventure that has become a family tradition among generations. Families and students, birders and scientists, armed with binoculars, bird guides and checklists went out on an annual mission - often before dawn. For over one hundred years, the desire to both make a difference and to experience the beauty of nature has driven dedicated people to leave the comfort of a warm house during the Holiday season. Each of the citizen scientists who annually braves snow, wind, or rain, to take part in the Christmas Bird Count makes an enormous contribution to conservation. Audubon and other organizations use data collected in this longest-running wildlife census to assess the health of bird populations - and to help guide conservation action. ---CBC Website -- Have students pull-up the CBC Website (www.audubon.org/Bird/cbc/). On the CBC Website, create a spreadsheet for the rough-legged hawk in North Dakota and South Dakota between the years 1968 (Year 68) and 2008 (Year 108). a. Steps: i. On left navigation bar under Results, click on historical ii. At the bottom click on By Species under the middle chart iii. Type in Rough-legged Hawk in the name box and click Search iv. Select the first entry (Rough-legged Hawk), click Add v. Select 68 as the start date and 108 as the end date vi. Select North Dakota and South Dakota from the region box, clicking Add for each. vii. Click Make a Table on the bottom right of the screen viii. On the next screen, click download the data—this makes an Excel file of the data. b. Then, insert a line graph with the year (x-axis) and the number per hour (y-axis)--instructions below: Rough-legged Hawks observed (CBC) in ND and SD between 1968 and 2008 Birds per survey hour III. IV. 0.25 0.2 0.15 0.1 0.05 0 68 72 76 80 84 88 92 96 100104108 i. Select the Entire Column “Numb Per Hour” –this is the number of rough-legged hawks observed per hour of survey. ii. Click the Insert Tab, then select a Line Graph iii. Right Click on the x-axis and click on Select Data—we need to change the x-axis values. iv. In the Horizontal (category) Axis Labels box, select edit v. Then select the Year column data and click OK, then OK again vi. To add the line, right click on the existing line, click Add Trendline, then Close. vii. Edit axis and chart titles as you see fit. c. Question: What is the general overwintering population trend of rough-legged hawks in ND & SD between 1968 and 2008? i. There is a general increase in the number of rough-legged hawks observed between 1968 and 2008. d. Question: What are some reasons for the fluctuation in annual observations? V. VI. i. Various Answers, including changes in precipitation, changes in overall population, researcher error (or different researchers), changes in prey abundance. Find temperature data at the Bismarck Station between the years 1968 and 2008. a. Have students pull-up Temperature Website (www.rimfrost.no/) i. Select USA, Select Bismarck ii. Type in 1968 as start and 2008 as end iii. Select Stat-Month in drop down iv. Select Graph Years & Trend in drop down b. Question: What is the general trend in temperature between 1968 and 2008? i. General increase in temperature between these years. Compare the temperature graph with the rough-legged hawk observation graph. a. Question: Does there appear to be a correlation between temperature and overwintering rough-legged hawk populations in ND & SD? i. Yes, there is a positive correlation between increasing temperatures and the number of overwintering rough-legged hawks observed in ND & SD Discussion Questions 1. List several sources of “bias” that a researcher should understand when using CBC data. Although there are some concerns with the CBC data, these long-term, landscape-or-larger scale databases provide some of the best current data concerning climate change effects on animal populations. 2. Research the diet of Rough-legged Hawks and provide a hypothesis for the trends in overwintering populations that you observed in this lab. A correlation between snow depth and the number of rough-legged hawks in this area was illustrated by comparing studies during a low snowfall year—2006/07 (Jones, Ducheneaux, and Guinn) and a high snowfall year—2008/09 (Luger, Halsey, and Guinn). Rough-legged hawks have small feet and catch mainly mice and voles—deeper snow makes it nearly impossible for them to find their prey. 3. Recently, a hybrid Bald Eagle x Stellar’s Sea Eagle was observed for the first time (Clark 2008). Stellar’s Sea Eagles are a Russian and Asian species that is becoming more common in northern Alaska because of climate change. What impact would a larger, more aggressive eagle hybrid have on the Bald Eagle population? What impact would this hybrid have on Indigenous people who revere Bald and Golden Eagles? Currently in ND & SD red-tailed hawks and rough-legged hawks do not occur in the same area at the same time. However, continuing changes to the distributional patterns of these species may result in increased competition for limited winter resources. Alternatively, if climate change expands changes to distributions of these species in the spring, hybridization may result. The consequences of hybrid Buteos in the community are unknown.


