Scale-Scores-for-All-Students
advertisement

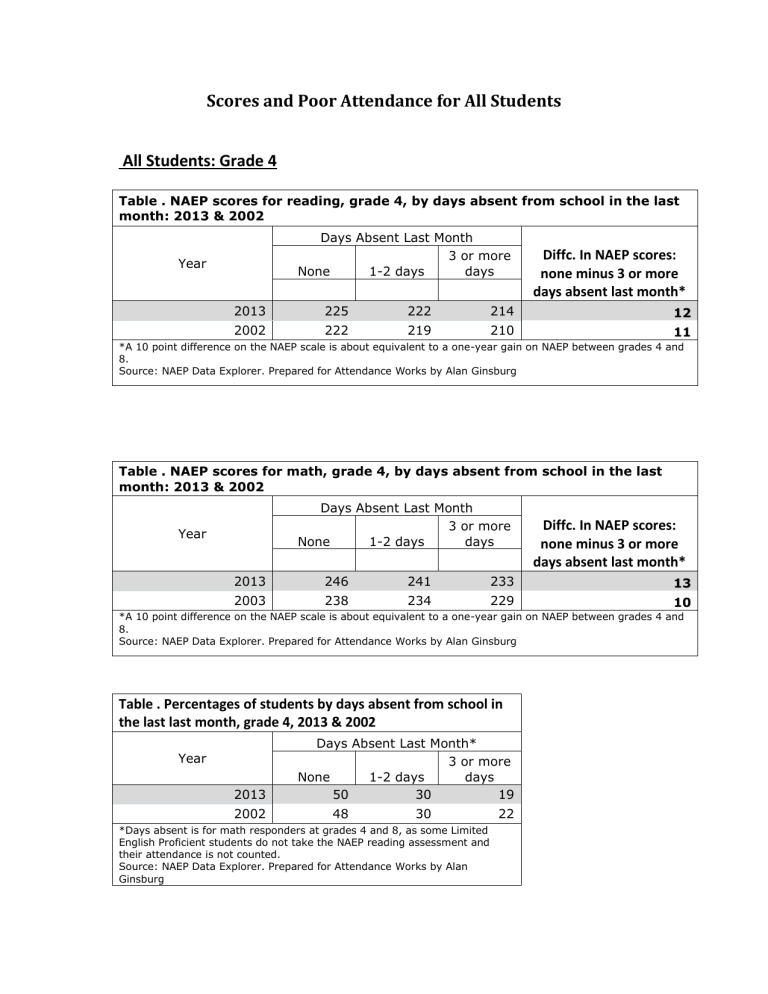
Scores and Poor Attendance for All Students All Students: Grade 4 Table . NAEP scores for reading, grade 4, by days absent from school in the last month: 2013 & 2002 Days Absent Last Month 3 or more None 1-2 days days Year Diffc. In NAEP scores: none minus 3 or more days absent last month* 2013 225 222 214 12 2002 222 219 210 11 *A 10 point difference on the NAEP scale is about equivalent to a one-year gain on NAEP between grades 4 and 8. Source: NAEP Data Explorer. Prepared for Attendance Works by Alan Ginsburg Table . NAEP scores for math, grade 4, by days absent from school in the last month: 2013 & 2002 Days Absent Last Month 3 or more None 1-2 days days Year Diffc. In NAEP scores: none minus 3 or more days absent last month* 2013 246 241 233 13 2003 238 234 229 10 *A 10 point difference on the NAEP scale is about equivalent to a one-year gain on NAEP between grades 4 and 8. Source: NAEP Data Explorer. Prepared for Attendance Works by Alan Ginsburg Table . Percentages of students by days absent from school in the last last month, grade 4, 2013 & 2002 Year 2013 2002 Days Absent Last Month* 3 or more None 1-2 days days 50 30 19 48 30 *Days absent is for math responders at grades 4 and 8, as some Limited English Proficient students do not take the NAEP reading assessment and their attendance is not counted. Source: NAEP Data Explorer. Prepared for Attendance Works by Alan Ginsburg 22 All Students: Grade 8 Table . NAEP scores for reading, grade 8, by days absent from school in the last month: 2013 & 2002 Days Absent Last Month 3 or more None 1-2 days days Year Diffc. In NAEP scores: none minus 3 or more days absent last month* 2013 271 269 258 13 2002 268 267 256 12 *A 10 point difference on the NAEP scale is about equivalent to a one-year gain on NAEP between grades 4 and 8. Source: NAEP Data Explorer. Prepared for Attendance Works by Alan Ginsburg Table . NAEP scores for math, grade 8, by days absent from school in the last month: 2013 & 2002 Days Absent Last Month 3 or more None 1-2 days days Year Diffc. In NAEP scores: none minus 3 or more days absent last month* 2013 290 285 272 18 2002 283 279 267 16 *A 10 point difference on the NAEP scale is about equivalent to a one-year gain on NAEP between grades 4 and 8. Source: NAEP Data Explorer. Prepared for Attendance Works by Alan Ginsburg Table . Percentages of students by days absent from school in the last month, grade 8, 2013 & 2002 Year 2013 2002 Days Absent Last Month* 3 or more None 1-2 days days 44 36 20 44 34 22 *Days absent is for math responders at grades 4 and 8, as some Limited English Proficient students do not take the NAEP reading assessment and their attendance is not counted. Source: NAEP Data Explorer. Prepared for Attendance Works by Alan Ginsburg f


